


Inside bars, outside bars and test bars summary.
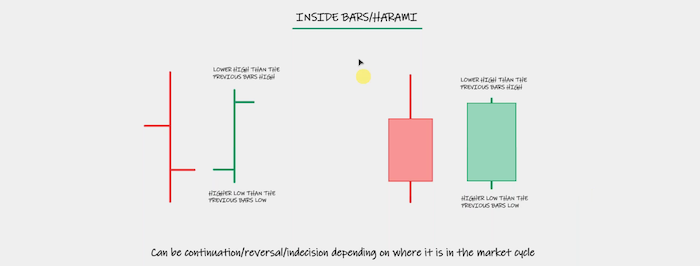
Inside bars
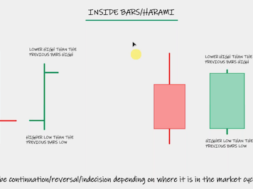
A double inside bar can have even more inside bars that ends up being called a symmetrical triangle
A double inside bar is extreme indecision inside bar can be a continuation, a reversal or incision. Mainly seen the reversal. It just depends on where it is in the market.
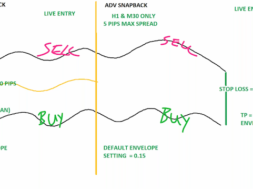
So if you were selling, would you do move your stop loss down?
We are master traders to Trader boys and girls, not just looking at the one to ones or the 180 and the pip runners. Now we are looking at price action to guide you. Price action is giving you that warning you’re going to move your stop loss.
We like us to have two warnings before we move a stop. By the way, one warning might be a bit premature.
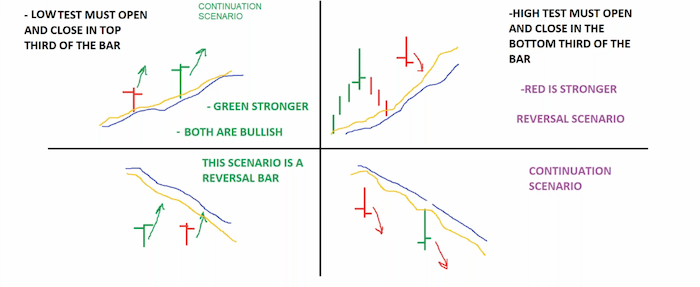
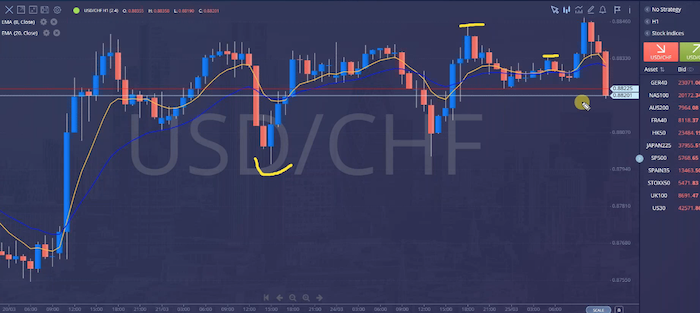
Low Test bar, as I said, is one of the stronger ones, low test is stronger,
Red inside bar after two low tests in a downtrend, what is stronger trend or price trend? If you see price fighting for trend, go with the trend. Please make a note that the trend is going to be stronger. This is a downtrend. We have lower highs and lower lows. We’ve got phase one coming down, and this is trying to give us. I want to go up. I’m going to still override it and go with the trend. It doesn’t move up.
Double inside bars are rare to find on the chart when you see that, it means extreme indecision. Again, the trend overrides the bar. If you don’t know which way to trade it in and trade it in the direction the trend,
which may have been up or down,
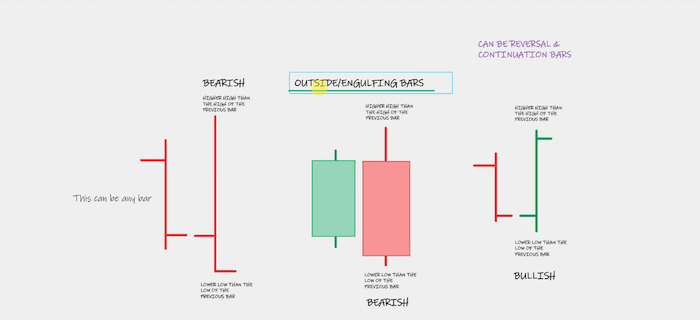
Opposite of an inside bar is an Outside bar outside bars are similar to inside bars in that the colour really depends what the market is likely going to do next. So if you see an outside bar you know that that outside bar is telling us this market may reverse, or if I see a bullish outside bar in an uptrend market it is likely going to continue, If we see a red one, market is likely going to reverse than if you’re in a downtrend.
That red bar is likely going to continue, making it an engulfing bar. An outside bar that is a higher high than the previous bar, at a lower low, than the previous bar.
You are allowed to trade them, but you need to write the name of the bar.
Look at this reversal. I may hear some traders talking about the body of the candle being the reversal. So as long as the body engulfs the other bar it is a reversal outside bar.
Then you get big ones that really cause a stir after seeing all of these buyers sink that outside bar.
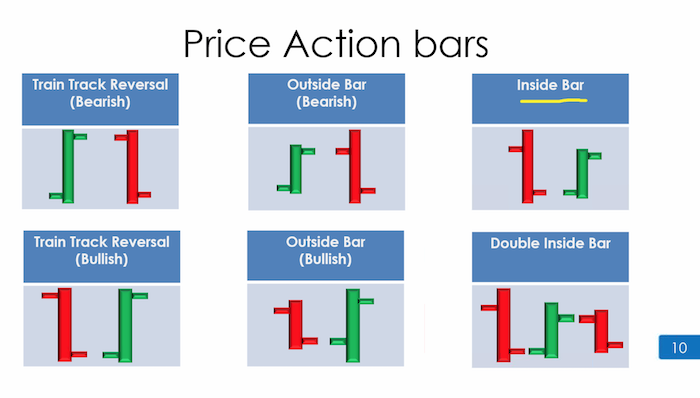
Train track. Train track doesn’t need to have the exact same high low. It’s the body that we are counting. So it’s the opening on both bars and the close that will be 90% or more identical or very similar.
What you’re looking for is a body of a candle that looks almost identical, and it’s a reversal signal. We go with the direction of the second bar. This is bearish because we’ve got an up down reversal, or a down up reversal. That’s what it’s called. So they don’t need the highs and lows to be the same.
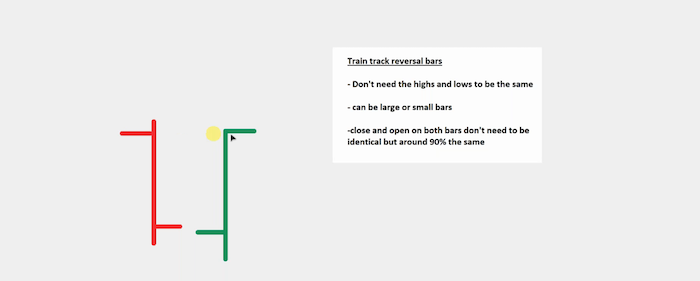
It could be large or small, but we do need the open of that bar, the close of that bar, to be roughly the same, and the close of this bar and the open of this bar to be roughly the same.
Someone asked about the gap in the market has a different open that’s why these bars are powerful, because in forex, unless there’s lots of news going on, you won’t see that happen a lot. You’ll just see the bars mirroring each other like this. This is a train track reversal that would be bearish.
The market didn’t break below. The market didn’t break the low. So you would have just cancelled the order you get a train track like this body’s a look at the body of the two candles. And it just so happens that this is a bullish engulfing bar, so the pushing up actually wasn’t a surprise.
These are train track reversals and again, it happens on all time frames. You can trade train track reversals you choose you can do so have a look for some more. This is probably one of the best ones you’ll see which does exactly what it’s meant to do, as is this one as well, if you want an image of them, these three, in fact, brilliant train tracks. The bodies look the same. Market pushes up, bodies look the same. Pushes down, bodies look the same. Pushes down. Number of bars it pushes down by isn’t important. Colour shows direction.
like everything else, would then offer price action, trade price action off of a level. Last bar I want to show you is not in the manual. It’s an important bar, and I already showed you too long ago.
You’ve got it was a lots of sellers coming down, and then there was a typical, normal, typically, normal player bar wasn’t a test bar wasn’t inside or outside. Was just a green bar. The lower low, the lower high.
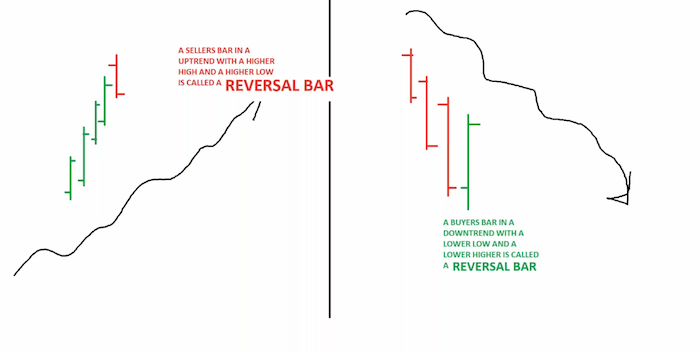
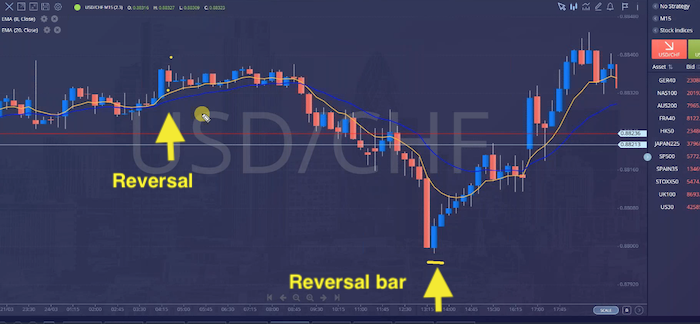
Please make sure you take a screen grab of this, because it’s not in the manual. This is a condition that happens quite a lot, that will throw you off , if you are in a downtrend, and you see a buyer’s bar with a lower low and a lower high. It’s just the reversal bar.
It’s showing us that the market is likely going to reverse. It’s the same for the seller bar. I drew this one with a gap because it does happen, as you witnessed, but less likely if you see a seller’s bar in an uptrend with a normal higher high and a higher low,
not a test bar, not an inside, not an outside, not a doji, just a normal seller bar, it’s a reversal bar. This is something that can be forgotten quite a lot, so try to keep your eyes open for them, because when they appear, you’ll be kind of happy, so glad I know what this is, because, look, it’s a warning. It’s a clear warning to the one we spoke about before. In a up trend, there’s another one, normal size bar, and there you have clarity.
Remember we did inside bars and test bars. In fact, we do talk about that in the next slide. But you remember I showed you inside bars that will also be test bars, the major types of price action.
Example, double inside doji bar, inside high test doji outside bar. Further experience with these plans will help to increase your understanding of where future price action is likely to move. As you learn to use these price action setups, you’ll be able to capture turning points more effectively.
You must be aware that these are not 100% successful. They provide you with an edge, combined with other techniques you will learn throughout the rest of this course, they can give you a positive rewards to risk in a high probability setting up, we’re saying, is learning these bars on top of what you already know, can give you more comfortability in your market, understanding what the market is likely to do next, because you’ll start to understand doesn’t happen randomly. You’ll know that more often than not, that low test bar or that outside red bar, will likely push the price down six, seven times out of 10.
Double inside bar is extreme indecision. Remember that if you got it wrong.
Bars and Trend Direction
- Inside Bars – A smaller bar within the high and low of the previous bar.
- Trend: Signals consolidation and potential breakout in either direction.
- Outside Bars (Engulfing Bars) – A bar that completely engulfs the previous bar’s high and low.
- Trend: Signals strong momentum; a bullish engulfing indicates upward movement, while a bearish engulfing suggests a downward trend.
- Train Tracks – Two long bars of opposite colors with nearly equal highs and lows.
- Trend: Reversal pattern, often signaling a trend change.
- Doji Bars – A bar with a small body and nearly equal open and close prices.
- Trend: Signals indecision; can indicate a reversal if found at the top or bottom of a trend.
- Head and Shoulders – A peak (head) between two smaller peaks (shoulders).
- Trend: Reversal pattern, signaling a bearish trend after an uptrend.
- Inverted Head and Shoulders – A low (head) between two higher lows (shoulders).
- Trend: Reversal pattern, signaling a bullish trend after a downtrend.
- Double Top – Two peaks at roughly the same level.
- Trend: Reversal pattern, indicating a bearish trend after an uptrend.
- Double Bottom – Two lows at roughly the same level.
- Trend: Reversal pattern, indicating a bullish trend after a downtrend.
- 1-2-3 Reversal Pattern – A three-step price structure marking a trend reversal.
- Trend:
- Bullish: Forms after a downtrend, creating a higher high (Point 2) and higher low (Point 3).
- Bearish: Forms after an uptrend, creating a lower low (Point 2) and lower high (Point 3).
- Trend:
Reversal Patterns
- Head and Shoulders (Bearish)
- Inverted Head and Shoulders (Bullish)
- Double Top (Bearish)
- Double Bottom (Bullish)
- Engulfing Bars (Bullish or Bearish depending on direction)
- Doji (Depends on confirmation)
- Train Tracks (Trend reversal)
- 1-2-3 Reversal Pattern (Bullish or Bearish)