


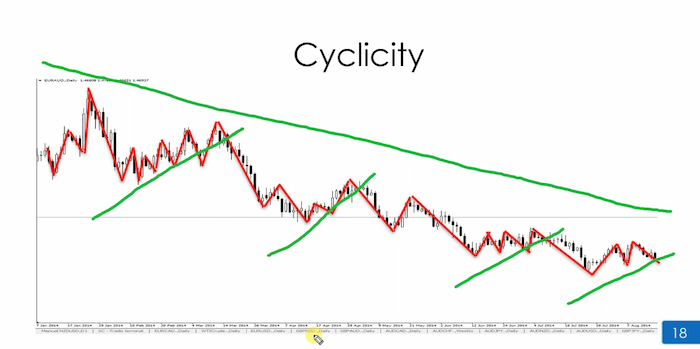
Let’s talk about cyclicity. Please tell me what trend this is?
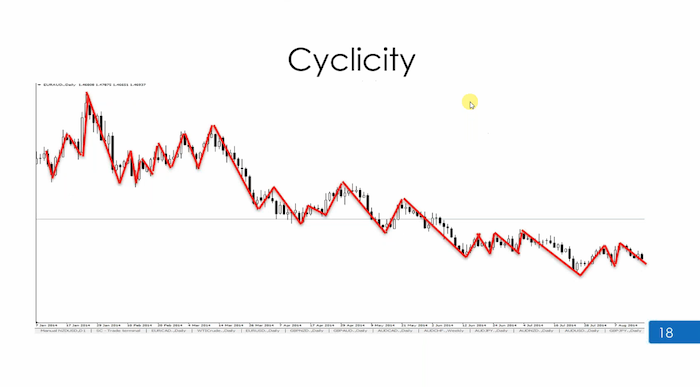
Those of you that are confused about reading trend, then become less confused. A lot of you have been reading the trend incorrectly. Final answer what trend is that?
If you drew lines on this the way I showed you, your answer would be closer to no trend. I can see why someone might end up with no trend. However, it tells me that you’re not following the exact rules we need to follow.
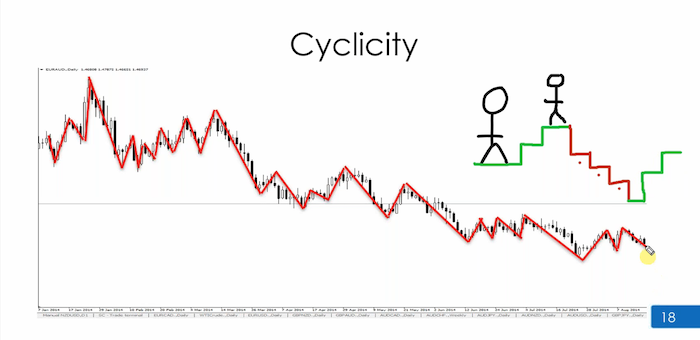
Let me ask you all a question. This is me standing what is that in front of me? Please join in. I know the question may be simple, but please join in, everyone. What is that in front of me?
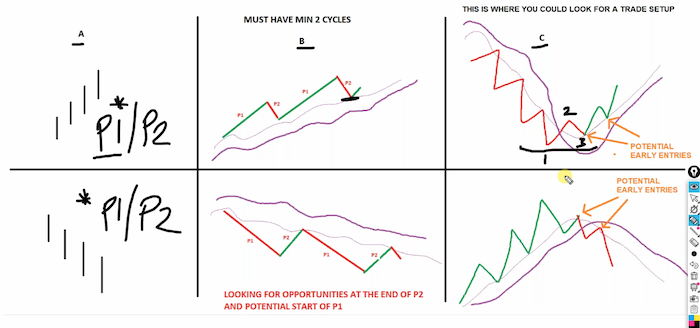
What is that called? It is a step correct. When does it become stairs? When we have two cycles, I’ve got two steps. Now do I have a down Staircase or just a down step.
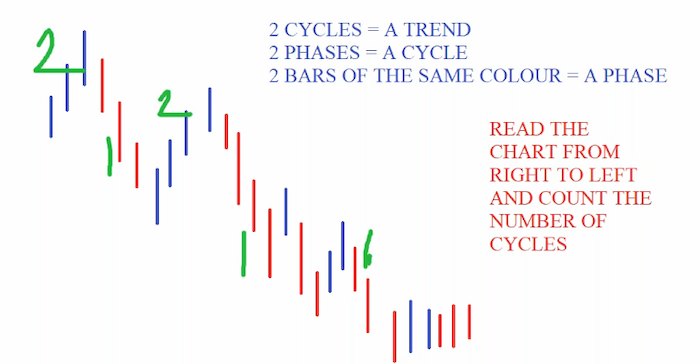
Its just a down step, just a step down, very small staircase. The man is standing at the top, looking down. All I can see is a step here. He looks again, and guess what? He sees, 1,2,3, steps, three cycles. He has now a down staircase, which is also a downtrend.
When does that downtrend become an uptrend here. What trend is this chart in?
This mistake was made by a lot of you is that you are reading the chart from left to right, but when you are reading a trend and this is a trend that nobody can argue with, you are meant to read the chart from right to left because we’ve asked you, so what trend are we in?
Now, if you read the chart from right to left, higher, high, higher low high, low. One. I have two cycles. Yes, this is a trend within another trend. But the facts are, I’ve only given you one instruction, which is, what trend is this in?
If you said downtrend, that is not correct, it means you are looking at this entire move. I said, what trend are we in? If you said up trend, well done. If you said sideways, it’s also not correct. But I can see the confusion people reading chart from left to right, right to left.
Can everyone see that when you’re reading a trend, you need to stick to one set of rules? Some of you cannot afford to make this error. This is super important. This is this subject we’re going through now. This section of the course is more important than the price action. If you’re going to master anything first, it should be this.
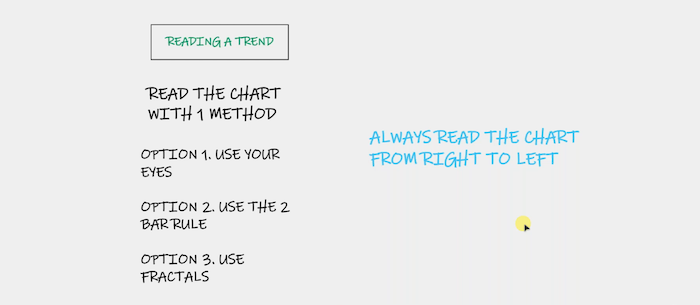
You have to be able to read trends and understand your cycles and cyclicity. So number one, one always read the chart from right to left. Confusion, if you look at this and tell me it’s a downtrend, it will be incorrect, because if you read from right to left, you can see the trend has broken structure.
This is no longer a downtrend. It was coming down, but it’s now breaking up. That’s how we’re able to spot the differences in the market. If you look at something too far back, you can easily make a decision and sell.
That’s a downtrend. It’s too far to look at this. I said, What trend is this in? It’s impossible for me to tell you anything other than this is in an uptrend. It doesn’t matter why it’s in an uptrend, but it is in an uptrend.
Just to inform you, the moving averages are not as important. Price is king. The moving averages don’t tell you what trend it’s in. They support the trend. So what I’d like to see is an uptrend with my averages in order. If they’re not in order, then I leave it alone. But when my averages are in order with the trend. That gives me two rules confirmed. In order to read the trend accurately, you need to use one of three options on the left here.
First and foremost, some of you are at the level where you’re able to use your eyes in the same way I’ve just done I can see very quickly that this is lower than that. This is lower than that. These are my swings. You might ask, why I’m choosing them. It just becomes a habit. You see what? You see some of them you could ignore. You might say, well, that whole thing’s one. Some of you will say, No, I can see where the sellers are trying to come in. I can see where the buyers are coming that’s how I would reiterate with my eyes.
The second option is point number three on my list, but it’s not a second option I’ll give you is the fractals. The fractals act as a nice buffer between your learning, sort of getting your head around what is going on this. Make these nice and big. The fractals do a job for you. The fractals act as those highs so if you see a fractal lower than a fractal and a low lower, that is where you would say, well, that is clearly my trend, not going to argue, yeah, not going to argue. But this is where the problems do begin, because that’s too close. You then go as that, where does that go? Because there’s a fractal there. There’s no green in between. This is what causes confusion. So if there’s confusion, you simply go, well, not going to go back that far.
I’m just going to stop here, because that doesn’t make me comfortable, because I can see that was higher than that, but this is lower than that. So right now, I’ve got my cycles. Some of you will prefer the fractal. Some of you will prefer to if you make the fractal third number, then it will get rid of some of the noise. So if you go with fractals, three that will get rid of the bars. If you’d like to look into how fractals are calculated, you can Google it, but you will see areas like this that has one green here, but no greens all the way till there. So then you think, Well, there’s two reds. How do I draw this? You don’t you have to do that and go here and ignore that one.
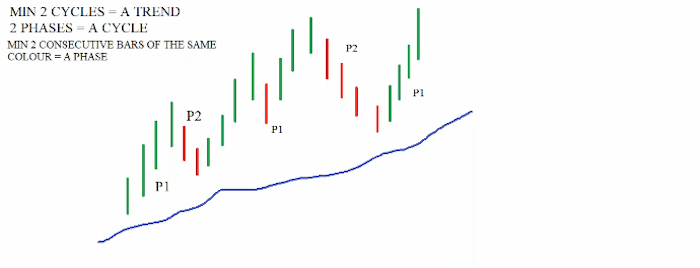
The last option is what we call the two bar rule. This is the two bar rule. I’ll come back. Two bar rule is minimum of two consecutive bars of the same colour, equal in a phase.
If you sit with a mentor and you show them what you’re doing, they can spot what you’re doing. It’s just like watching a golfer hit a ball. I can watch you and say, Hang on. Stop a second. Move your left foot inwards a bit. Move your right arm. Here, move your head here, if you sort of do this by yourself and want to show us winning trades, you’re wasting a lot of time. So I don’t want you all sort of going off thinking this out. No, so think about that. As we said before your last course that had you had spent time with your with a mentor myself, remember, we would have seen that you were prioritising the amaze and said, Nah, you’re getting it wrong.
Price is king. It is two cycles that makes a trend, and it’s two phases that make a cycle. Now you know to have a true phase. If you want it to be black and white, you would say, I need two consecutive bars of the same colour to be a phase that is four, that is four, and this whole thing is my phase my eyes might pick that one, but I’m not going to pick that one because I know I need two consecutive bars of the same colour to be a phase. Why? Because it means I don’t have to think anymore. I just read the two bar rule.
Have a look at this one. This is a down example. You can’t call this a phase because it’s one buyer bar doesn’t matter whether you like it or not. You said I’m going to do the two bar rule. This is the two bar rule. Minimum, two bars are the same colour, so if it’s three, that’s fine. Phase one, phase two. If you don’t already know this, Phase one is always in the direction of the trend.
We don’t always already know this is always in the direction. It’s not about strategies. You’re going to realise how simple the strategies are, because the software does a lot of work for you, but if you don’t understand market structure, you are absolutely finished.
P
So we drew the staircase. We drew the staircase we want you to see before we do that. Any questions on this? And can you all commit to one, two or three, please. You’re going to choose one of these for now, and you are allowed to make changes down the line, but you have to make a decision. You might say, no, what? I don’t want any sort of indecision. I want black on white wall. I’m going to use this, and then my eyes will eventually see the trend. Then I’m going to end up using my guys.
Please write in the box what your option is. If you are further along and you feel comfortable, then you do what you’re allowed to. Choose both. You’re not allowed to mix them up. You’ve got to choose one.
What will happen is eventually you will become accustomed to a certain way, and then you’ll go, oh man, I don’t want to do it anymore. Fractals are throwing me off. I can see what you’re saying now. Now I’ve got better. I will start using my eyes. That’s fine. Everything works.
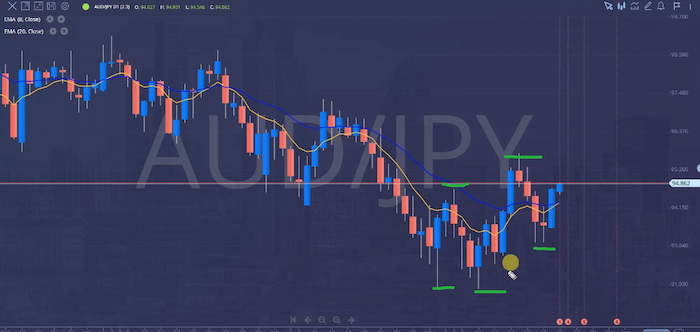
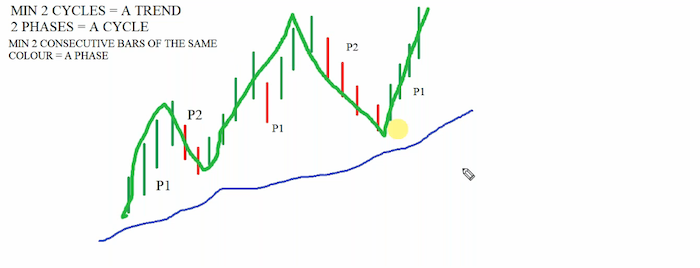
With that being said we then need to get used to spotting the end of te move because what you’re all seeing here is a downtrend. It’s just that we’ve got bigger phase 2s within the bigger move.
How do we spot that? We spot that because the market is making higher highs and starts to make lower lows or higher highs, starts to make lower lows, lower highs. And what you’re going to do is you’re going to use the following pages to help you spot the end of the trend.
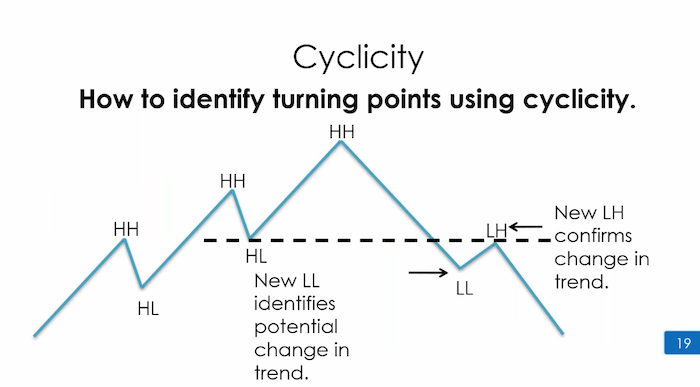
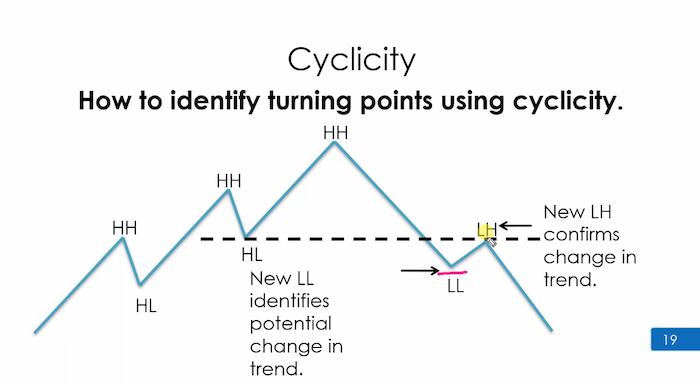
This is where reversal patterns come from. You are looking at what we are calling in an uptrend. You have
a higher, higher low, but then a new lower low identifies a potential change in trend. When you see a lower low, this is what we call a break of structure.
Everybody wants to trade to go to the moon. It doesn’t. It will eventually make a lower low, and then we need to see a lower high to confirm the change in that trend. This is what we call a reversal pattern.
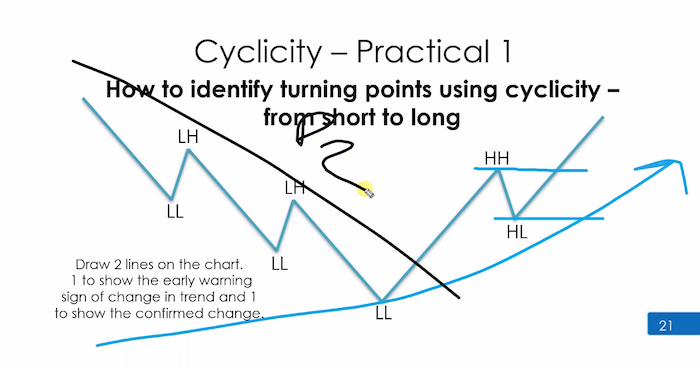
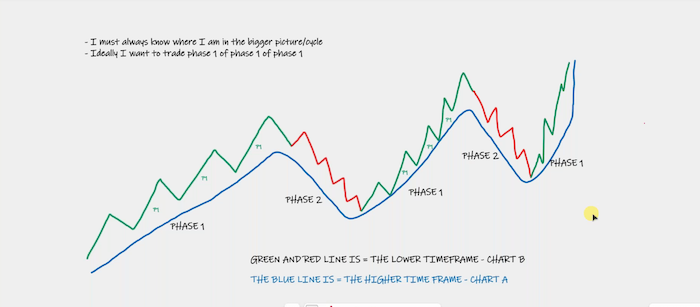
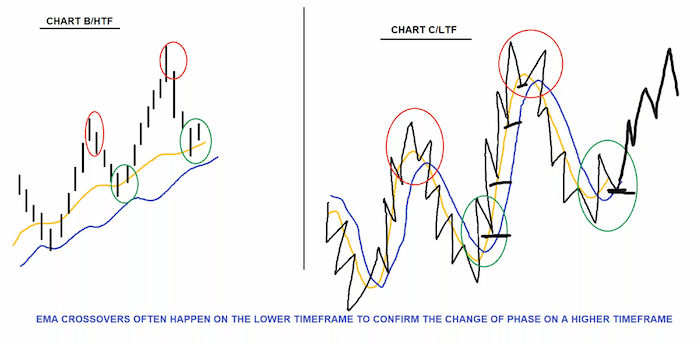
This is actually this. The trend is down. This is phase two of time frame. It’s the lower time frame, these blue lines that will then break structure and give us a new move. And the same goes here. Same goes here. These are the two lines you’re looking at uptrend. This is really just phase two of the higher Time Frame.
What is this trying to show you?
This is trying to tell you when a trend ends. It’s all well and good understanding that we read the trend from right to left. If I said to you right now, this trend is in no trend because we’ve got a higher low and a higher high, (LHS of RH pair) but we’ve only got one cycle. But this was a downtrend.
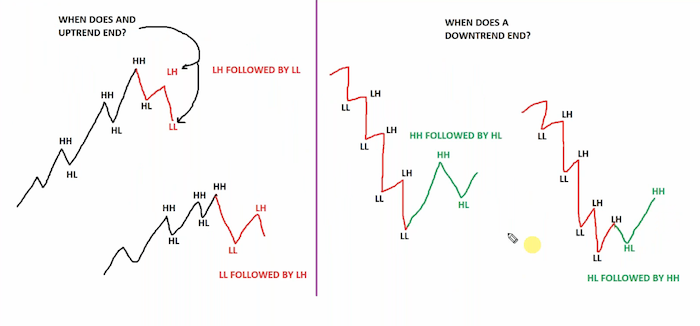
We knew the trend ended because we had a higher high and now a higher low. So the downtrend is now over. Traders, do you understand that the downtrend is now over. This is over.
The uptrend higher highs, higher lows. But hang on, we’ve got a lower high followed by a lower low. Traders, can you see when you hear Dev and the other guys talk about breaking structure, it’s because the market stopped making the highs and the lows that you are familiar with. (LHS).
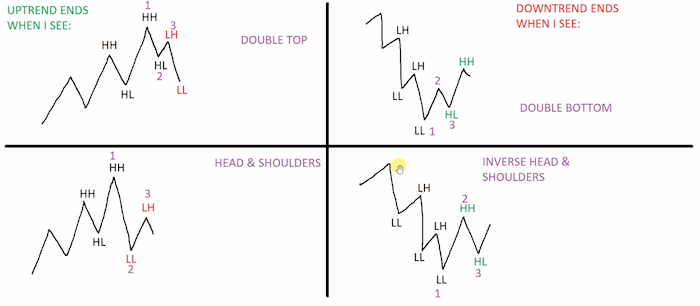
What is this trying to actually tell us what you’re looking at are four trading patterns. They are four trading strategies that you can happily type into Smart Charts and use them. In fact, this is what the PIP runner is actually looking for. The PIP runner is looking for that break of structure. Hence the reason why you have fractals on PIP runner those patterns are also known as reversal patterns, and they are known as the 1,2,3 reversal pattern, which is the double top, double bottom, head and shoulders and inverse shoulders.
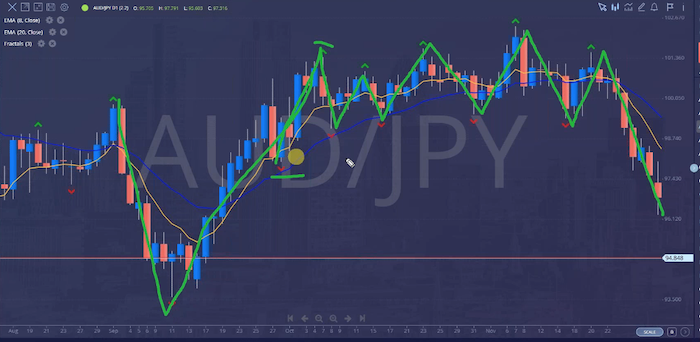
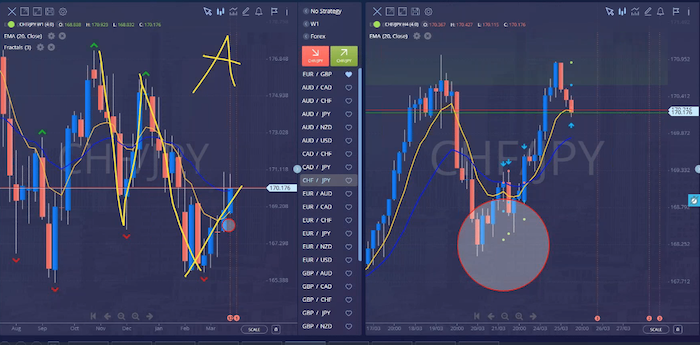
What we have here is really a higher Time Frame uptrend, and that is just the phase two. That’s really what’s going on. Going to show you more on this. This is just a phase two, trying to go into phase one. What we look for at double bottoms, head and shoulders, and this is the opposite coming down. There’s a really good example of this right here, which was spotted. Have a look at this.
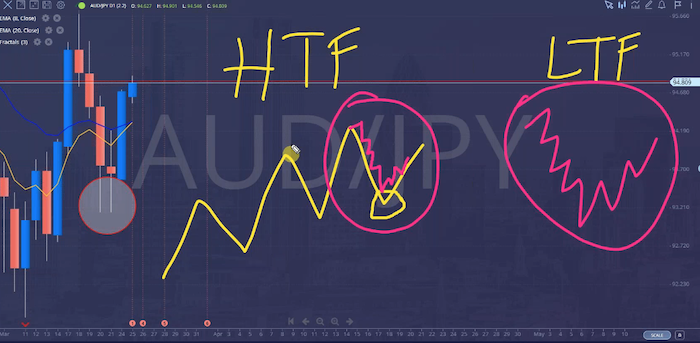
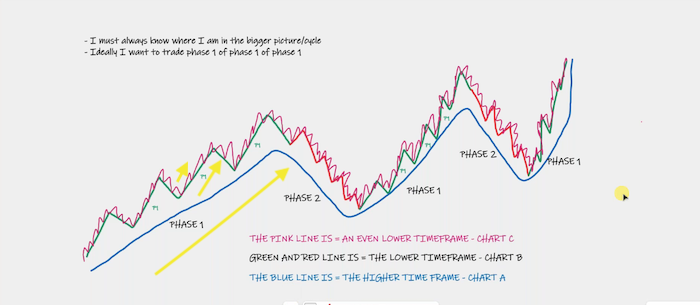
So a higher Time Frame train does this. This is doing what this is doing right here,(yellow circle) the lower time frame will look like it’s going to show you this area here, This. (pink zigzag) See this, the lower time frame will do the
who’s getting this frame was doing phase one, phase two, phase one, phase two, phase two will look like a What train. What trend is this? Just this area. Everyone. This area here. What trend is this? The downtrend? Yeah, but it’s really but it’s really phase 2 of the higher Time Frame.
One, two. Remember phase moves in the direction of the trend. There is a double bottom. We’re actually using the change of phases to get in with double bottoms and double tops, head and shoulders.
Yes, have a look at this. So can you see this is the higher Time Frame daily. Phase two, it’s gone into phase one. How do we know that? Remember, we spoke about the power of the market, this has broken the high, this low, this high and this high And this low. Look what that then becomes, what’s this?
It’s going to highlight that. Highlight the two lows. Watch what happens when we go to the four hour.
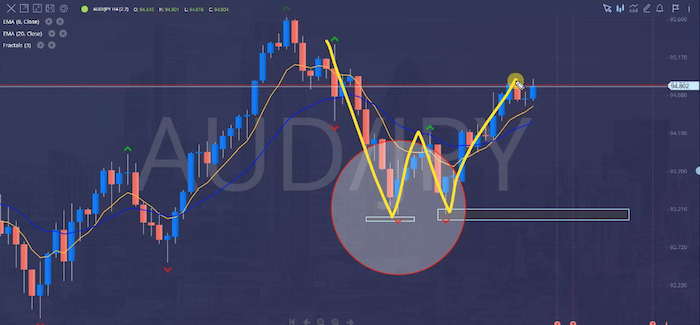
Because a bigger time frame that looks a bit crazy. Look at that. And you will see the double bottom here. How cool is that?
This is essentially a Pip runner, just on a four hour.
That’s how we Yeah, good. That is the pattern we’re looking for. Everyone we know the markets broken structure because it’s made a higher high and equal lows.
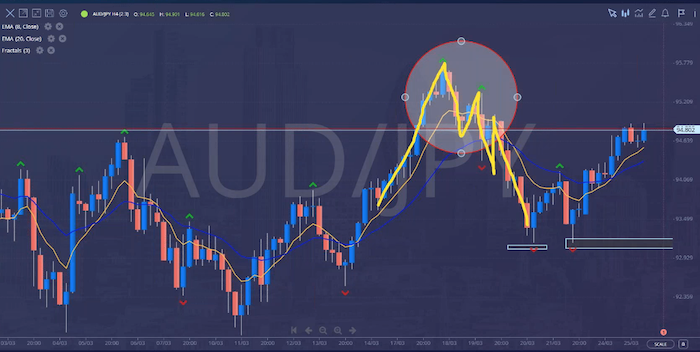
When this went from phase one to phase two, look at what the market did, highs, then lows, the lows. Look at that double top on a daily phase one changing to phase two. Even better, high test bar.
So this every this whole chart, time frame correlation thing, because why trend traders have to pretty much master the trend first. It really isn’t about anything other than mastering the trend. Mastering the trend means.
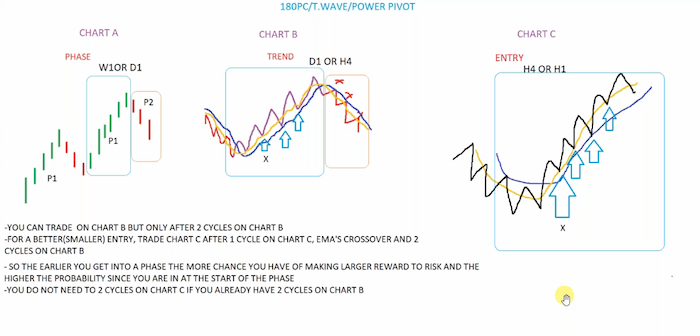
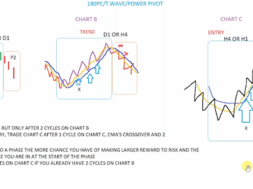
What you are all seeing is what I need you, and I really mean that I need you to understand this diagram here.
Your trends are not in isolation. How many of you have fallen into this trap before you pick up a chart and you see a downtrend, and you start selling it. Happy Days profit. Happy Days profit. Oh, dear. Why is it turning on me? What’s going on? Who’s been in here before looking at one chart, and it starts to work, and then it turns. Yes, guilty, guilty. But what are we missing? What are we actually missing? Remember when I asked these questions. Yes. Bigger Picture, zooming out, higher Time Frame correlation, yes, yeah. When you step back, you realise, oh, this is just phase two of the higher time frame.
4.20 Day 1
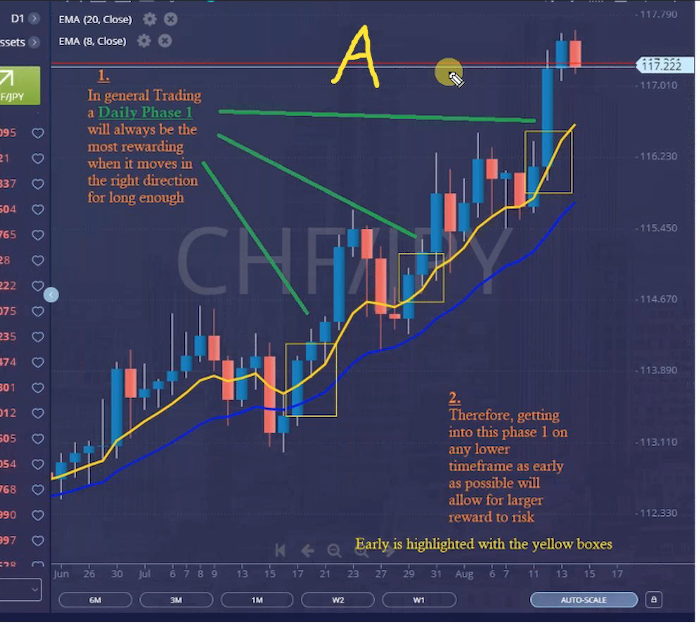
So ideally, what do I really want to be doing? I want to be trading the phase one of phase 1. So some of you would trade the phase two, but jump out and stop. Or better yet, even if you took this and lost this one, you wouldn’t be offended, because, you know, the bigger picture is up. So when you get off this horse, you jump back on a new horse, and you go, Well, I know I’m in phase one anyway, phase one, I know the trend is really up. So I’m not stressed.
It definitely was for me, course, trading in the wrong direction. Some of you have been doing this. We did this in one of the boot camps where you draw yourself a trend line on the phase two or the downtrend right. You say, Fine, when it breaks. I’m interested. This is what we’re trying to do. The higher Time Frame and lower time frame. You want to be in agreement. We want to trade phase one of phase one. Why is there a third phase one? Well, first of all, you must always know where you are in the bigger picture, the cycle. What phase am I in? What cycle am I in? Second of all, you want to trade phase one. As we are growing master trainers, really, there’s a third diagram. This should now make sense to a lot of you. We’re actually trying to trade phase one of phase one of phase one. You want to trade this part of this part of this part why? Because phase one, phase one typically lasts longer.
It’s about timeframe agreement. We want to have at least two timeframes in agreement. And eventually, please make sure you don’t panic with this. Eventually you will understand how to get three timeframes in agreement.
Before I show you some more, there’s lots more to show you. I need to draw lines. Yes, do that. Why is it that phase one typically lasts longer because it’s within the direction of the trend. So the trend trader wants to stay in the best part longer. So you’ll see that bigger movement will last longer, because that’s where everyone’s making money most. When you get serious trend traders, they don’t trade phase two. It’s people that are new, like yourselves and like myself, when I started that were trying to be smart and try and trade phase two.
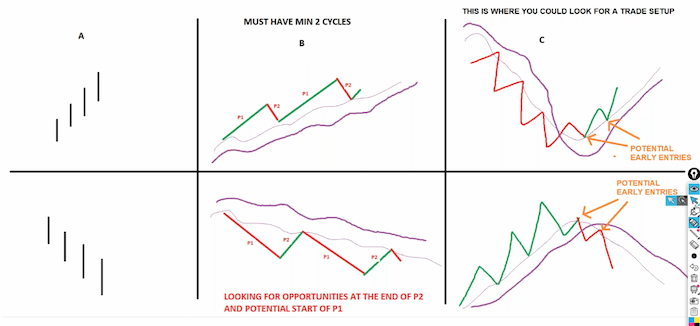
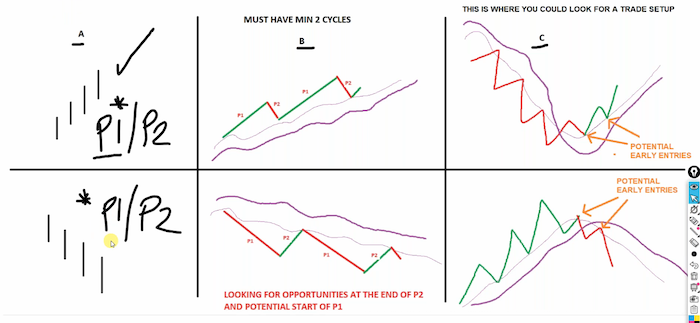
Here’s the diagram broken up into three. By the way, you don’t need to be the smart alec trying to catch the small phase 2 people are happy waiting for this to happen, because that’s where the big buyers are coming in. This is a buyers market. So there’s more buyers in the market. That’s why the phase one lasts longer.
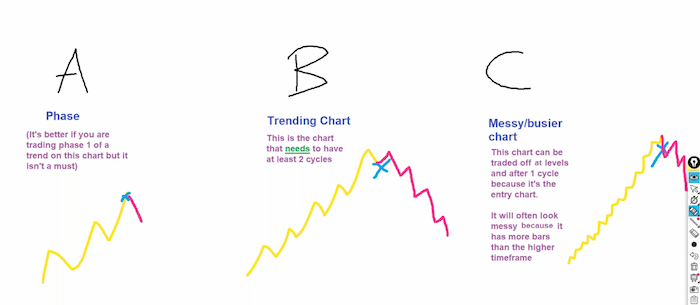
I’ve broken this up to show you that you can write this down. You can trade phase phase two of this one. And the reason why this one is not as important as this one is because we get the general direction from this. So what I’m interested in is my chart B having two cycles. Chart B needs to have two cycles. If chart B is in two cycles and chart a is in phase one, then you’ve got two ticks. If it’s in phase two, you get one tick because you can trade phase two of the highest time frame. You’ll see why that is. But most people would prefer the Phase One that’s why there is an asterix next to this.
What other questions havet we got here, I lost on two trades today because only two timeframes in agreement. That might not be why you lost to go through that, in coaching might not be why you lost those sometimes you lose because you lose. Two timeframes is more than enough, because it’s like saying we get three timeframes, you’re gonna win.
We need to look at it in a second. See the trends. Yes, well done. Here are all three diagrams, broken apart for everyone, for you to see what we’re looking for.
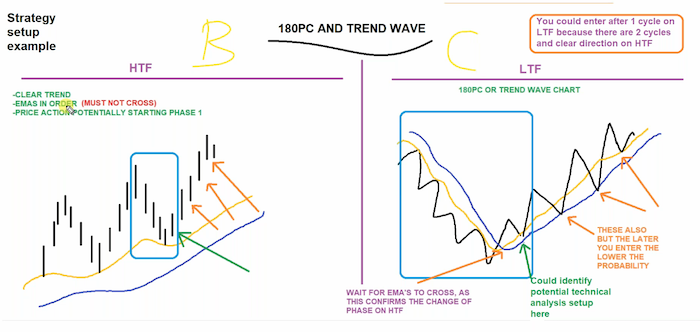
The ideal scenario is that this is in a phase one. This has got at least two cycles, and we’re trying to get in here. Who can spot the pattern I’m just showing you there. This is how we trade double tops and double bottoms. We can do that manually. And also please note the double bottoms, double top reversal patterns can happen before the EMAs cross.
I’ll talk to you about the significance of the EMA crossing, but they can happen before the EMAS cross. But what you’re going to find yourselves doing in this area is looking for a PC 180 or a T wave or a Power pivot or one of the other strategies here. This is a typical 180 T wave setup, and why they are our bread and butter. I’m going to say something to you that you might not believe. There are many traders that we teach that we have that solely trade the 180 and do very well. They’ve not paid for any upgrades. They don’t want to. They’re happy with the 180 why is that? Why do they do so well? Because they’ve realised that it’s not about the 180 they realise that if they can get the higher Time Frame trending, as I said two time frames is enough, and get in on chart C early after the cross, when the market is trending, they will capitalise.
The problem is, most of us are not patient. We want the market to trend all the time, so when we get impatient, and we go and we go and learn a volatility reversal. Meanwhile, those traders that might be looking at a weekly chart or a daily or four hour or one hour, because you can do this now, you understand, guess what they’re doing. They’re just waiting, and they know they’re going to capitalise on this, this and this. And when that loses, they go fine, or wait and they go again. When it carries on, they go again.
You’d be surprised. Some people just trade the Pip runner on their own, and some of you will get on better with the strategies in this course, there’s a lady that has learned the power pivot from Master trader, and she abandoned the 180 and T wave. When you look at the power pivot, you’ll realise it is similar to the 180 and T wave, but she just prefers it. This diagram, for me, is probably one of my favourites, because it does give you a black and white tool that says when the EMAS crossover on the lower time frame. It typically confirms the change of phase on the higher time frame into my circles. So if you want something to guide you, you can use the EMA CrossOver on your lower time frame. What does that actually mean? This is my high time frame. Go to my four hour look. There’s a crossover.
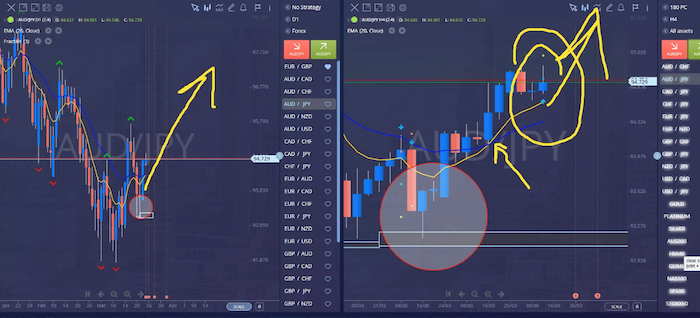
Look at this. There’s a cross, and this is the area I’m waiting for a face changer. If the Australian Yen is going to go up, this will continue. It’s got nothing to do with it, with whether you hope or pray, or whether you’ve been good this year so far. It’s got nothing to do with that. This is just a probability thing. And I can tell you that because if you go back and look at this over and over and over again, you’ll see the same pattern repeat itself. What I’m showing you with my diagram is everything. Traders.
You want chart B, you need to start with B. Write that down. Start with B. This is the chart that needs to have cycles of this chart is cycling if this is going in phase one.
So let’s do this. Let’s say we happen to see that and that great. But even if it doesn’t matter, this could be going down. This could be here. You just become aware that, okay, I’m trading with phase two of the downtrend, so I’ll catch the first couple of moves, and then I’m going to stop, and eventually stops and turns into phase one, and you resume your Trend. It’s better if you’re in phase one, but it isn’t a must. That’s why it says that it’s this chart here that catches a lot of you out. You do not on this chart because we’ve got cycles here already. We’re just looking to get in early. That chart will often look really nuts and messy.
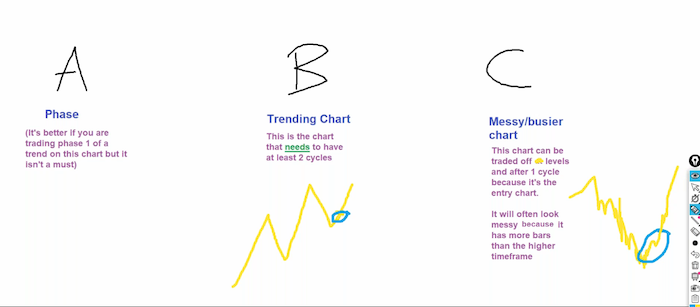
That is why a lot of people get put off by the Pip runner, because they’re looking for the trend on the Pip runner, which isn’t correct you need to be looking for the trend on the higher time frame, which is either the H1 or the H4. If I show you a Pip runner, you’ll go, Oh my gosh. Now I get why the pit runner looks so mad, and I can’t trade it. This chart can be traded, and after one cycle, because it’s the entry chart. It will often look messy because it has more bars than a higher Time Frame traders.
This is how this works. You’re about getting in here, you’re trying to get in here, and then the market eventually does something like that. When you start to see this, it becomes so much easier. I can’t stress that enough, it’s almost crazy. How you think Hang on. I This looks quite easy. Why did it not look like this before? Because I was looking for something else,
15 minutes, four hour, and I’m looking for the trend of one hour. This is what happens when you look for a trend on all time frames.
This is what happens. You end up buying here (yellow/pink lines). Tell me if you recognise this yourself, you end up here. You end up here. So your mind says, Well, look, all three of them look fantastic. Who’s been here before? Because this is what happens next.
And you’re swearing blind that Greg sat in a room watching your trade, thinking surely the broker stealing my money. Yes, is where people go. They want all three charts to be brilliant. No, if all three charts look neat, you are too late. Please make a note. If all of your time frames look neat. They look fantastic. You are late. It means you’re late to the party. You’ve missed it. Make a note of that. You don’t want chart C looking neat. Chart C should look messy. This is what chart A, B and C actually what is chart A, B and C?
It’s whatever time frame you want it to be based on the key I’m giving you. Your A is weekly, your D is B, and your C is H4, or this one is the most one. This the one that people tend to use a lot. This is the time frame that my chart be. Is if you guys listen to my workshops, boot camps, you’ll often hear me talking about this.
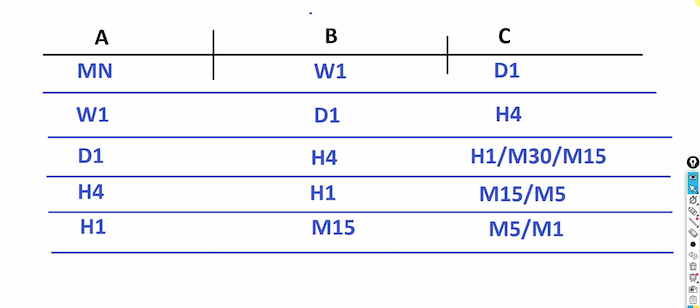
Why do I use an h4 because I’ll often get in on an h4 or I’ll go down and get in around here, and maybe I’ll get in on the 30 minute if I can’t see the pattern. But my chart B is H4 it doesn’t change. It’s my chart B because that’s what fits in my lifestyle, within my mentoring, within my other practices and other life things, family, Health, Music, other projects. This is what works for me.
We might say, well I’m giving myself a two hour window, one in the morning and one in the evening. What’s best for me as chart B, because it means I can catch some really good moves and I’m not sat waiting for too long. Those of you that cannot dedicate this time, you’re like, look, I’ve got kids. I’ve got to look after my mom and my dad, and my business is really booming (H1). I want to do this. And as I showed you earlier, my friend, she used to do this. Doesn’t matter. You can just trade these two. You don’t have to go here. But as you get better, you will eventually get three timeframes in agreement.
The reason I’m looking for chart B here is because it’s the easiest chart to do that on.
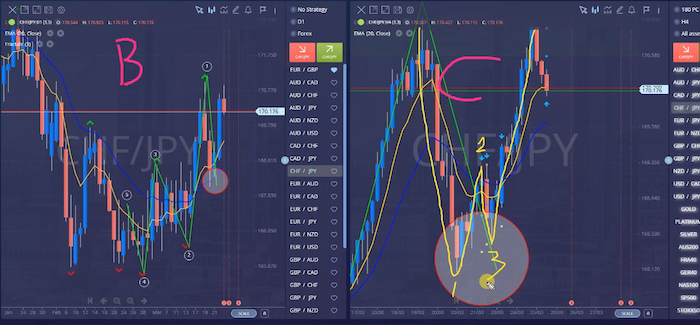
I start with B. Everyone I start with B. Look, one, two. I’ve got two cycles. I don’t care what the rest is doing. I know I’ve got two was the lower low one, two cycles, beginning of phase one. This is my chart, B. Start with B. I’m going to say this quite a few times so it sticks. Start with B. Everyone. This is B. This is C. Why is this C? Who can tell me what this is? You’re going to get an extra you’re going to get the trip to Hawaii, if you get this right. Who can tell me what this is? It’s an AI trip, by the way, not a real trip. Too many of you might win the prize. Well done. What is that you can spot that? Well done, It’s messy, but that’s not the answer I’m looking for. Let me zoom in. What did I say we look for phases.
This Yeah, there you go. you win the holiday who else got the holiday? It’s a reversal pattern. It’s the 1 2 3, reversal pattern. Look at that. How cool is that? How does a 1 2 3, pattern work?
You buy above two, stop loss below three. I’ve got some slides for you in a minute. Don’t worry about that. That would have been your entry. Angela, you didn’t even have to wait for the crossover. Everyone Do you now see that?
I want to catch a move early after the crossover. This is what can happen at times. Sometimes the market will move very quickly. That’s okay. This here is the official correct signal. I would have liked to see a signal here, but it never happened, and it doesn’t need to happen. That’s just the way the cookie crumbles, not this one, because it’s not bouncing this bar, which will finish in the next five minutes. You don’t need to keep guessing what the time zone is when the times change. Just look at this information button.
This bar is going to close. In a moment, this is going to be the next ring high. That was the ring high, 180 but the market hasn’t brought you in. So what you’re going to do is wait in five minutes. Bar is going to flash. It’s going to be entry stop loss. I’m going to place that to show you exactly what this is.
 And if you’ve had a session with me before, you will then go, Oh my gosh, the guy’s a genius. Not me, the trading guy, whoever that is, look at this. It’s not me. This is not my rules. This is just help you understand it at master trader level. This is what you did in your first session with me maybe a few of you. Ash, perhaps someone else, some of you haven’t but this is chart B and chart C. Look that green arrow here is showing you that move that I said we’d like to get in, but it just so happens that the move after the crossover didn’t happen here. It’s happening somewhere here, but because it is the first pullback you can enter after one cycle on another time frame, as there are two cycles in clear direction on higher time frame, it means you can trade chart B Exactly. That is why this is a signal. This is the first cycle after the cross. Yes, if you looking at the two bar rule, that is the first cycle after the cross. I did say I prefer it to be here, but we didn’t have a signal, so there’s nothing getting traders if we go up to chart a now, look what chart a is doing. Everyone.
Look what chart A is doing. What phase is chart A is chart a is in what phase? Please say what you see again. Phrase, it’s in phase 2. So what does that do for us?
That allows us to be careful? It allows us to be careful. It doesn’t mean it can’t keep going, but it allows me to be careful. Say, Well, hang on, the trend is actually down, so perhaps I won’t buy this, because that is phase 2. If the market does move down more, I don’t want to be in it. I’d rather have been in this if it was a phase 1 where, if there was no clear trend, and it was just a green, green, green, green or blue, blue, blue. This is a good chart for us to watch over the next week or two to see what develops.
If the Swiss continues getting stronger, this will push up. If not, you will see this make a failed attempt and do that. So what some of you might do with your analysis is as follows. My Chart A is in phase two. I want to be a seller because I want to trade in the direction of the trade. So this is a no trade for me. I now need to wait for my chart B, which is my daily to do this. I don’t want this to go higher. I don’t want that to go higher. I want to see that from that. If it does, it means I’ve got that and that one two cycles, it means I’m going to trade that somewhere here, and that’s how we build a picture days and weeks in advance.
You’ll hear Jitan talk about this sort of thing, where he’s got his eye on stuff and he’s waiting. This is how we build and wait, because we’re looking at multiple time frames traders. Are we doing any questions? Hopefully this is all coming together for you, putting the piece together so you can use that crossover to get you in early. And it doesn’t matter what strategy you’re using, it’s the same. The rules are exactly the same.
Pip runner traders, guess what you’re doing? The exact same thing this time there is no crossover because the EMAs are bigger. This is a 36 and 100 you actually don’t need the crossover. You won’t even get the crossover in the way you think. This is what makes a pip runner, the bolly bounce work. Those of you that are looking at the bolly bounce or haven’t had much joy with it is because you don’t understand that you’re really trying to trade the change of phase.
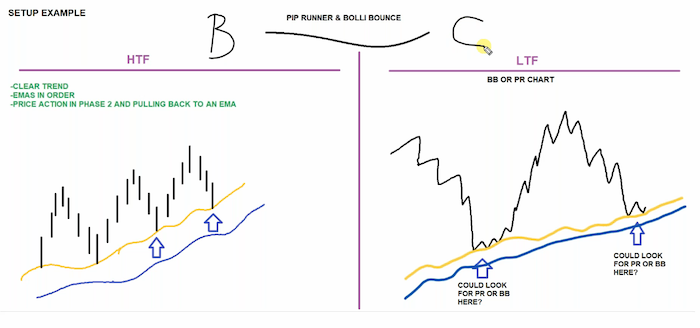
So you need to check your higher time frame, and then look for a bolly bounce here, and then look for a bolly bounce off the Bollinger that’s what makes it work. The Pip runner is the same. You want to take the PIP run off an average but only when the higher Time Frame is trending. The rules are the same for the trades, the strategies that we cover in SIC. How many pairs do we we do this for at any one time, I would say, have at least five pairs, three to five pairs. You’re watching three to five assets. You wouldn’t do Aussie yen, Swiss yen, CAD yen, Swiss yen, because there’s all yen. So you wouldn’t do more than 2% against any one currency. And you wouldn’t do you things like gold and silver at the same time that correlation is too much.
So just for the adventure, I’m actually going to put this on. Put it on you’ll expire at the end of the bar. Just to show you that is A, B and C, we have acknowledged that we don’t love A, A is not what we want it to be, but that’s fine for now. There’s a lot of reasons to be bearish on the yen. Some of you might be doing it already, but we’re going to see what happens with this, and then leave it to show you tomorrow. Sometimes we don’t, we don’t get to do this in many master traders, but as we’ve landed on it, it’s fine.
I want to give you a previous diagram that I think will help you, because when we go for a break, I want you to have a go at this.
So I’ve given you a live chart a, chart B, chart C. I’ve given you drawings. I’ve got some more drawing to show you, but also I want to show you a previous one, some text in it that will help you understand this. So even if you just read this a few times during the break, your knowledge of this will increase exponentially. Please take a screen grab of this,
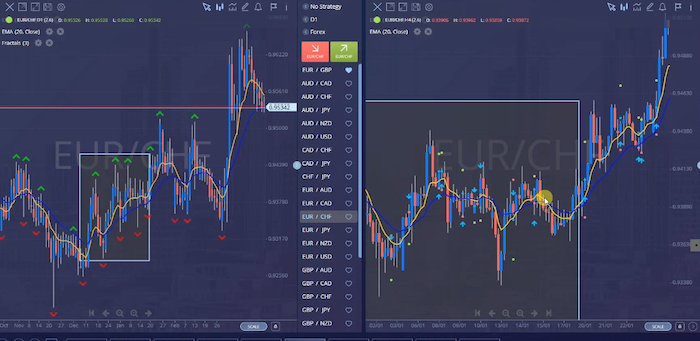
then I’ll show you. So this is chart. A look at the areas. This is a perfect area on the next chart you’re going to see on the next screen grab. Sorry, with the chart you’re going to see the chart B’s the chart B’s that are depicted by the green lines and the arrows will be where you would start taking your trades. So you can do chart a, leave chart C.
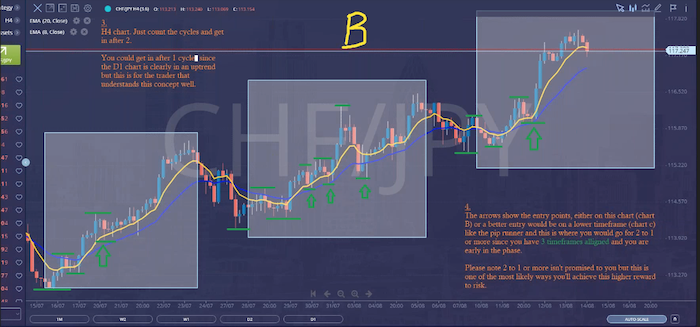
This is chart B. I’m not going to read this. You guys can read it in your own time. It’s about one, two, 2 cycles on B, you could just trade chart B and walk away. Look one, two, chart B there, four, so we can trade multiple cycles. The goal is to try and get in early, which is second cycle, if we feel confident and we have grown in our understanding, you will then understand chart C.
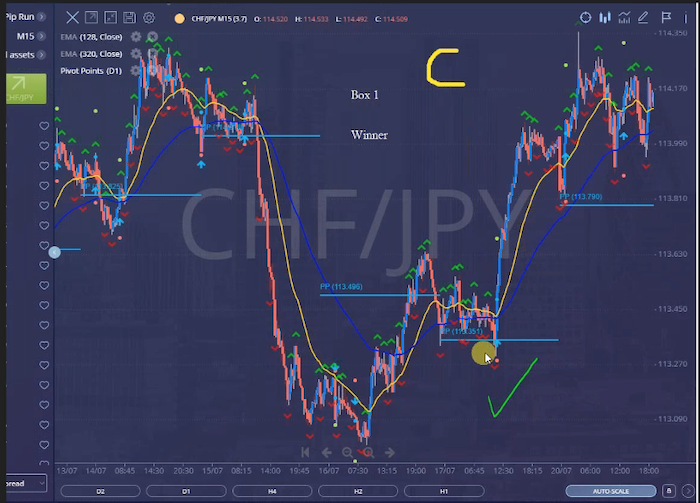
In the first arrows you can see within those three boxes is the second cycle. On the next screen, you see you will notice a tick or an x. This is showing you where you would have taken your first trade. So chart C is the messy one, that first box you just saw on the left of my chart B with the arrow. This is the first trade signal that appeared. Look at this chart, everyone. Is it neat or messy here? Forget the move that went on one prior to that this area here, is it neat or messy? That answer should be giving you what we spoke about. Yeah, it’s messy, isn’t it? But we don’t care about this chart. We’re not getting trend from chart C. Are we? We’re not getting trend from chart C. We’ve already tried, and we’ve got our trend in this case, from two previous charts. So all we’re doing here is making the final decision. Push the button, put the stop loss where it goes, set your take profit and walk away. That is box number one that produced a winner. Box number two, look, there were two trades here, three trades. Sorry, the three arrows you saw on sharp B, just look for the arrows above.
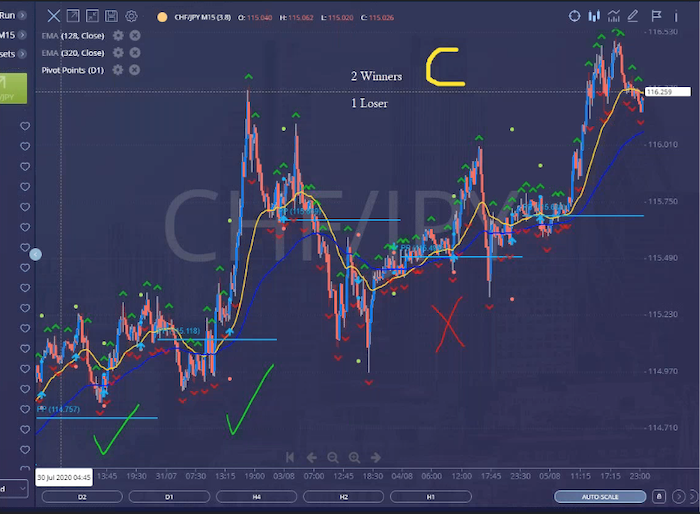
1, 2, 3, the three arrows you just witnessed are here. Now I’ve turned this into a loser. I’ve done that just because, but actually, it didn’t lose. You can see it did win. What I did was turn it into a two to one. So if you went for a two to one, what would have happened I both of these signals have actually worked, as has the third one, so yeah, and even if you did lose this one, you could have got it again here and here, look at how untidy chart C is. Please remember this, right? Don’t remember it, because it will be forgotten. Chart C can be messy chart C doesn’t need trend.
Look at this consolidation before the market rocketed up. What most people are doing is turning up here and expecting miracles, you’re not going to do that any more. You’re now using the trend from Chart A and B to get you in.
Everyone happy with that. This is what you are looking for, and I’m just picked a pip runner. It doesn’t have to be a pip runner. This is all about time frame agreement. I’ve got one more diagram for you to sort of take and get your head around this, and this will make life a lot easier for all of you.
You can see a nice chart A, B and C, and this is why I said to you that chart A can be phase two. If you know where you are, you can capitalise on two cycles here, and then there’s your chart C.
Yeah, in the manual, just so you know, there are a few slides here for you to just have a quick note of the different types of reversal patterns. I’ve given you the more detailed version, but the reversal plans we just discussed, they are in the manual.
You can see where the entry is. You can see the stop loss. So if you did label it double top, remember you’re doing double tops, double bottoms. It goes on Chart C. You’d only do this in chart C. You wouldn’t look for them elsewhere. Should you always get a signal on Chart C? You may not always get a signal. The point is, by the time you get to the end of this course, because I’ll be teaching you new strategies, you will get a signal, in some case, maybe 80, 90% of the time, because you’re not just using one strategy. Some people do want to use one strategy, or they need to in order to focus. So then you’ll get less once you’ve developed the knack for this, you’ll notice that you can use multiple strategies of getting in to get you in.
Do we have a look at a fourth time frame? You don’t need to do that. Once you become fluent at this, you’ll look at four time frames, five time frames, if you need to, but that’s not needed. You don’t need to. That’s just something you develop an eye for.
For charts A b and C remember the key, everyone. The key is what you need to follow. So please don’t do anything other than what’s on this I did this one wasn’t the top, but The second one I did this one on Swiss/Yen.
What chart do you need to start with everyone. Let’s make sure everyone knows what chart must you start with you?
I start with B. Start with B. Yes, start with B. Guys. Don’t start with a. Start with B. If you find two cycles on B or three cycles or four, then all you’re doing is checking a to see whether you’re in phase one or two. Go back and find examples, any chart you like. Just go find examples in the past. Just say, can I see a chart B with two cycles?
When you do that, you put a box around it, or draw the lines, or the Elliot, and then you go here, and what you’re doing is checking to see what phase it would have been in, phase two. Wow. Okay, that was phase two. I wouldn’t want it to be too aggressive there, because it’s phase two, but nonetheless, it was two cycles. And then you can decide to trade chart B on the second cycle. Or if you can get back far enough on the four hour, you would trade chart C at the beginning of the move, early after the cross. There’s anything there and anything there as well