Candlestick patterns in forex trading help traders identify potential reversals in price trends. A reversal pattern signals a possible change in direction—either from bullish to bearish or vice versa. These patterns are widely used in technical analysis to spot entry and exit points.
Key Candlestick Reversal Patterns
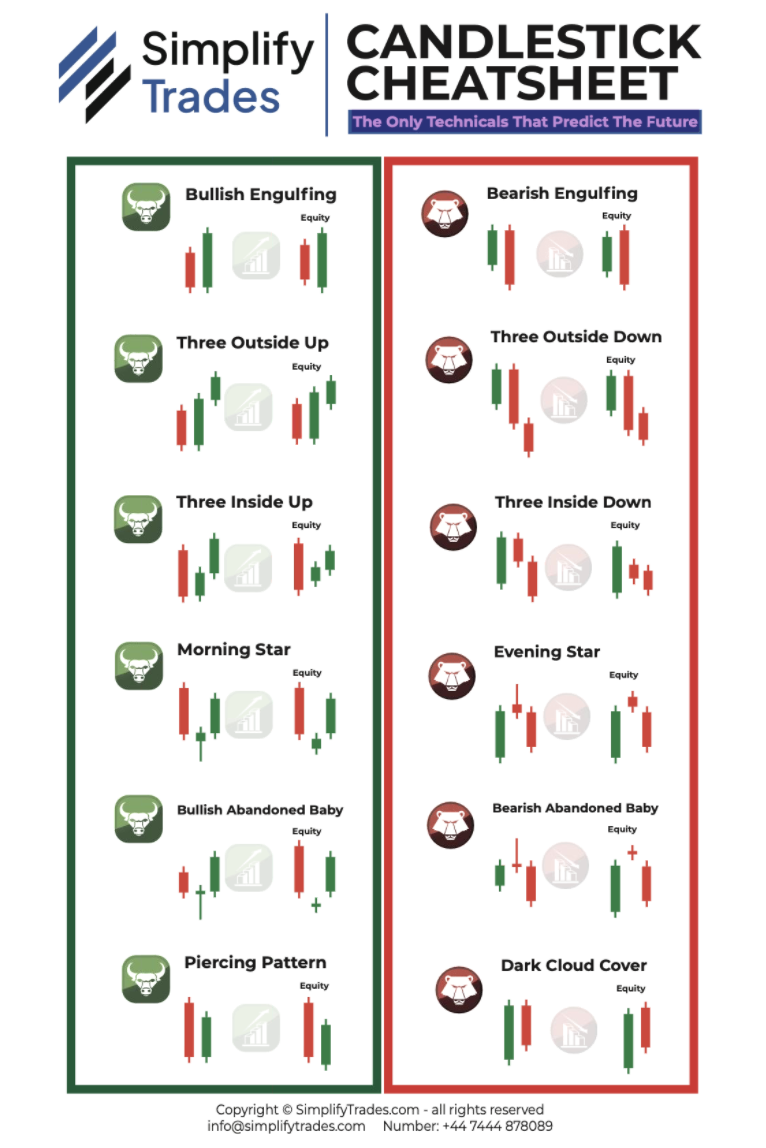
Some of the most reliable reversal candlestick patterns include:
Bullish Engulfing – Signals a shift from a downtrend to an uptrend.
Bearish Engulfing – Signals a shift from an uptrend to a downtrend.
Hammer – A bullish reversal pattern after a downtrend.
Shooting Star – A bearish reversal pattern after an uptrend.
Doji – Indicates indecision and potential trend reversal.
Morning Star – A three-candle bullish reversal pattern.
Evening Star – A three-candle bearish reversal pattern.
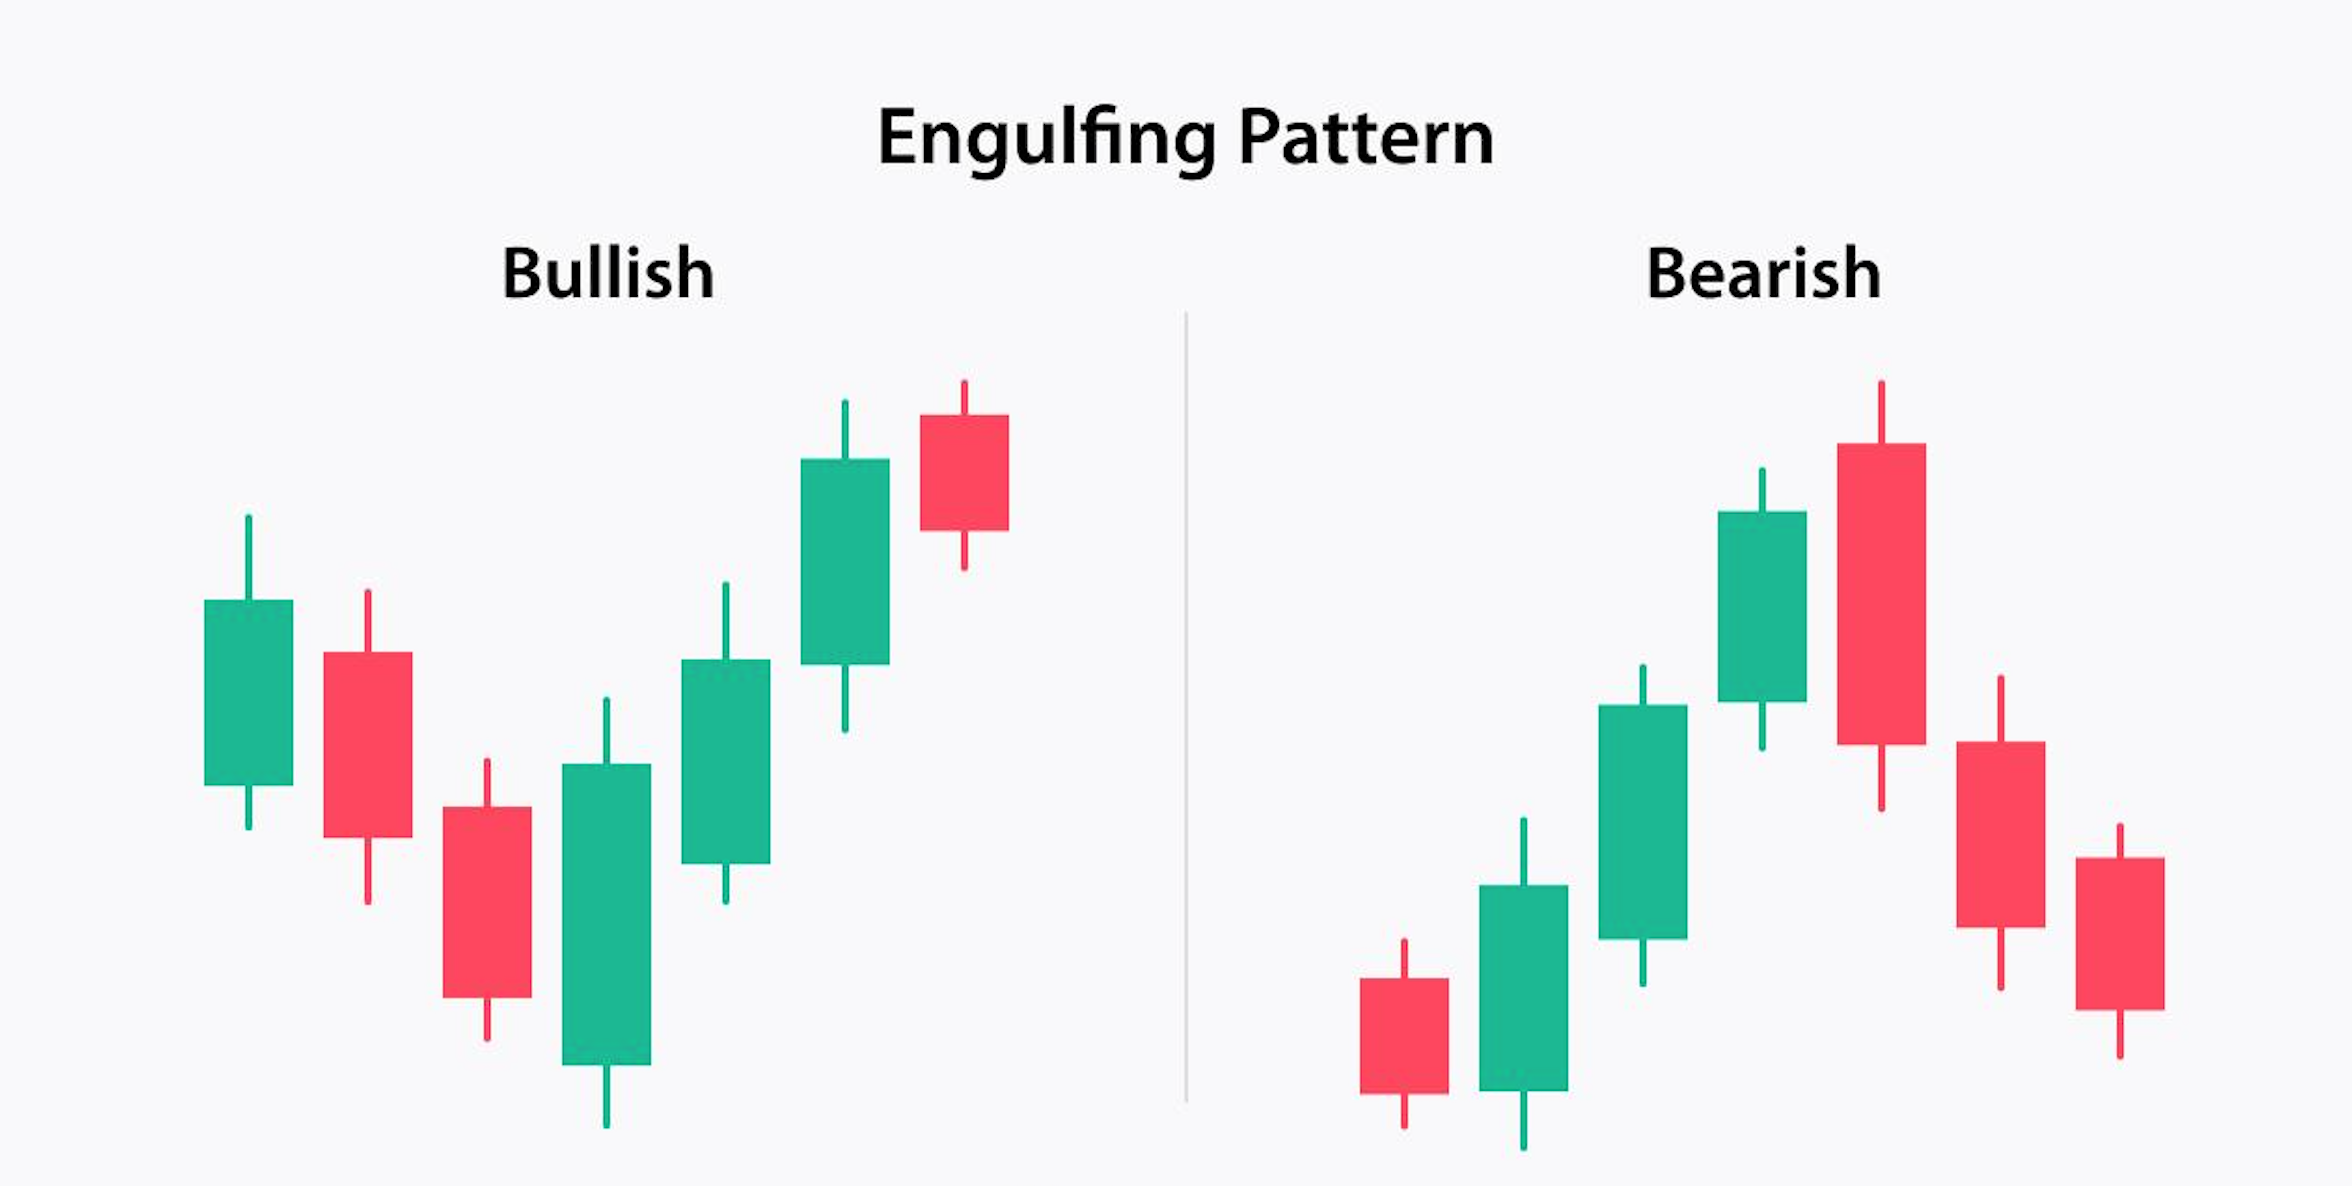
Bullish Engulfing Pattern
Definition:
A bullish engulfing pattern occurs when a small red (bearish) candle is followed by a large green (bullish) candle that completely engulfs the previous candle’s body. This indicates strong buying pressure and a potential reversal to the upside.
Characteristics:
Appears after a downtrend.
The second candle is larger and completely engulfs the first one.
Signals a shift in market sentiment from bearish to bullish.
Example:
Imagine EUR/USD has been in a steady downtrend. On the daily chart, a small red candle is followed by a much larger green candle that engulfs it entirely. This suggests that buyers have taken control, increasing the likelihood of an upward move.
Trading Strategy:
Enter a buy trade after confirmation (next candle opening higher).
Place a stop loss below the bullish engulfing candle.
Set a take profit at a previous resistance level.
Bearish Engulfing Pattern
Definition:
A bearish engulfing pattern is the opposite of the bullish engulfing. It occurs when a small green (bullish) candle is followed by a large red (bearish) candle that completely engulfs the first one. This suggests that selling pressure is strong, indicating a potential downtrend.
Characteristics:
Appears after an uptrend.
The second candle is larger and completely engulfs the first one.
Signals a shift in market sentiment from bullish to bearish.
Example:
Consider GBP/USD in an uptrend. A small green candle forms, followed by a large red candle that engulfs it. This suggests sellers are taking control, increasing the chances of a downward move.
Trading Strategy:
Enter a sell trade after confirmation (next candle closing lower).
Place a stop loss above the bearish engulfing candle.
Set a take profit at a previous support level.
Other Important Notes:
Volume confirmation strengthens the signal.
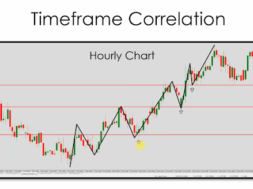
Higher timeframes (like 1-hour, 4-hour, or daily) provide stronger reversal signals.
Engulfing patterns near key support/resistance levels are more reliable.
For more detailed examples and live charts, you can check sources like:
Best Reversal Candlestick Patterns (Besides Engulfing Patterns)
Apart from Bullish Engulfing and Bearish Engulfing, some of the most effective reversal patterns are:
1. Hammer (Bullish Reversal) & Inverted Hammer
Appears at the bottom of a downtrend.
A small body with a long lower wick, showing strong rejection of lower prices.
Confirms reversal when the next candle closes higher.
2. Shooting Star (Bearish Reversal)
Appears at the top of an uptrend.
A small body with a long upper wick, showing rejection of higher prices.
Confirmation comes when the next candle closes lower.
3. Morning Star (Bullish Reversal) & Evening Star (Bearish Reversal)
Morning Star: A three-candle pattern with a small-bodied second candle (indicating indecision) between a bearish and a bullish candle.
Evening Star: The opposite, showing a transition from bullish to bearish sentiment.
More reliable on higher timeframes (H4, Daily, Weekly).
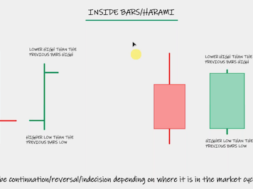
4. Doji (Indecision, Potential Reversal Signal)
A Doji forms when the open and close prices are nearly equal.
Signals market indecision.
If it forms after a strong trend and is followed by a confirming candle, it strengthens the reversal signal.
Types of Doji:
Dragonfly Doji – Bullish reversal when found in a downtrend.
Gravestone Doji – Bearish reversal when found in an uptrend.
Does the Number of Previous Cycles Matter?
Yes, the number of previous cycles in the trend is crucial when assessing reversal patterns. Here’s why:
1. Trend Strength & Duration
A longer trend with multiple cycles (higher highs/lows in an uptrend or lower highs/lows in a downtrend) has stronger momentum, meaning a single reversal signal may not be enough.
If the trend has lasted many cycles, traders watch for exhaustion signals like divergence with RSI or MACD.
2. Overextended Trends = More Reliable Reversals
If an uptrend has many bullish cycles without a deep retracement, a reversal signal (e.g., a bearish engulfing) is more reliable.
If a downtrend is heavily oversold, a bullish reversal pattern has a higher probability of success.
3. Higher Timeframes = Stronger Reversals
A Bearish Engulfing on the 5-minute chart is less significant than on the daily chart.
A reversal after multiple cycles on H4/Daily is more valid than one on M15/M30.
4. Key Levels Matter
If a reversal pattern appears at a strong support/resistance level, Fibonacci retracement, or a trendline, it’s more likely to be valid.
Key Takeaway:
More previous cycles = Stronger exhaustion = Higher probability of reversal.
Always check higher timeframes, volume confirmation, and key levels before entering a reversal trade.
Example Reversal Trade Setup Using Candlestick Patterns
Scenario:
Let’s say we are looking at EUR/USD on the 4-hour chart, and we see signs of a potential trend reversal using candlestick patterns, RSI, and MACD.
Step 1: Identify the Trend
The price has been in a strong uptrend for the past few weeks, forming higher highs and higher lows.
However, momentum is slowing down, and the latest bullish candles are getting smaller.
Step 2: Look for a Bearish Reversal Signal
At a strong resistance level, a Bearish Engulfing Candle forms.
The engulfing candle completely covers the previous bullish candle, showing strong selling pressure.
Additional confirmation: A Shooting Star appears right before the engulfing candle, further suggesting rejection at resistance.
Step 3: Check RSI and MACD for Confirmation
What is RSI?
Relative Strength Index (RSI) is an oscillator that measures whether a currency pair is overbought or oversold (0-100 scale).
Above 70 = Overbought (potential reversal down).
Below 30 = Oversold (potential reversal up).
In Our Setup: RSI is at 78, indicating the market is overbought, supporting the idea of a sell-off.
What is MACD?
Moving Average Convergence Divergence (MACD) is a momentum indicator that shows trend strength and potential reversals.
It consists of the MACD line, the signal line, and the histogram.
A bearish crossover (MACD line crossing below the signal line) suggests a possible downtrend.
In Our Setup: The MACD line crosses below the signal line, confirming a bearish shift.
Step 4: Enter the Trade
Sell Entry: Place a sell order right after the Bearish Engulfing candle closes.
Stop Loss: Place a stop loss above the recent high (just above resistance).
Take Profit:
First target: Previous support zone.
Second target: Fibonacci retracement level (e.g., 50% of the last uptrend).
Step 5: Monitor the Trade
If the price starts consolidating and shows reversal signs (e.g., Doji or Bullish Engulfing at support), consider closing early.
If the trend continues in your favour, trail your stop loss to lock in profits.
Why This Setup Works?
✅ Multiple confirmations (Bearish Engulfing + Shooting Star + Overbought RSI + MACD crossover).
✅ Trading with a clear structure (trend exhaustion at resistance).
✅ Risk management included (stop loss & take profit levels).
This is a textbook reversal setup that combines candlestick patterns with RSI and MACD for high-probability trades.
I’ll generate a chart example of a Bearish Engulfing Reversal Trade Setup with RSI and MACD confirmations. Give me a moment. ⏳
Here’s a simulated chart example of a Bearish Engulfing Reversal Setup with RSI and MACD confirmations:
Blue Line: EUR/USD price action, showing an uptrend followed by a Bearish Engulfing candle (marked in red).
Purple Dashed Line: RSI, which was overbought (>70) before the reversal and then dropped.
Green & Orange Dashed Lines: MACD and Signal Line, showing a bearish crossover as confirmation of the trend change.
This setup aligns with multiple reversal signals, making it a high-probability trade.
You said:
Show the same Bearish Engulfing Reversal Trade Setup diagram using the stochastic oscillator
ChatGPT said:
Here’s the Bearish Engulfing Reversal Trade Setup diagram, this time using the Stochastic Oscillator instead of RSI:
Blue Line: EUR/USD price action showing an uptrend followed by a Bearish Engulfing candle (marked in red).
Purple & Orange Dashed Lines:Stochastic %K (Fast) and %D (Slow) lines, indicating overbought conditions (>80) before the reversal and then crossing downward.
Green & Orange Dashed Lines:MACD and Signal Line, showing a bearish crossover, confirming momentum shift.
This setup is a strong reversal signal because Stochastic was overbought and crossed downward, aligning with the Bearish Engulfing and MACD crossover.