


Move on to the first official strategy of Master Trader. It’s called The Power Pivot. Now, if you’re new here, you wouldn’t know this strategy.
Power Pivot is a strategy that is just like the 180 Phase changer.
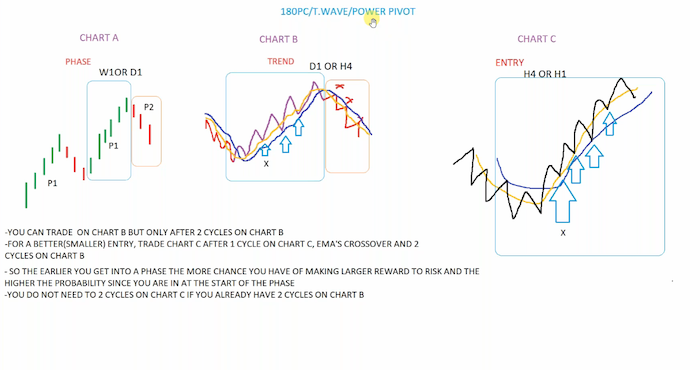
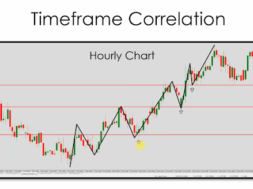
it is the cousin of a T-wave, the cousin of the 180 Phase changer. it doesn’t need any other rules in terms of time frame agreement. So, as you may have noticed by now, because the timing is everything, time frame correlation is everything, we can use a 180 Phase changer to get us in here. Use a T wave to to get us in here or here again.
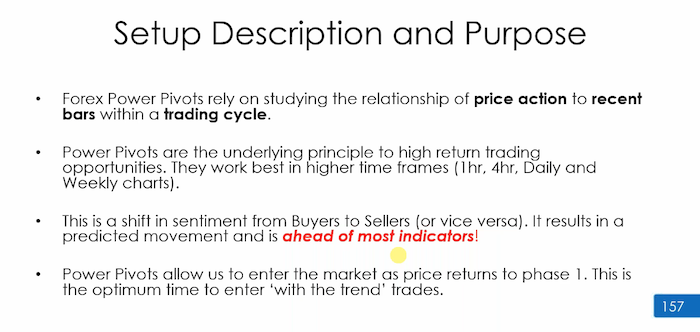
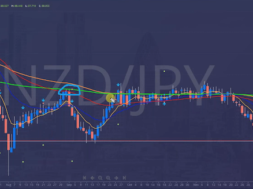
Now we can use a power pivot to get us in here. What is a power pivot? Power pivots are the underlying principle to high return trading opportunities. They work on all time frames, and it is pretty much about a shift from buyers to sellers, sellers to buyers in a downtrend, sellers to buyers in an uptrend.
There are not too many differences between the two strategies.
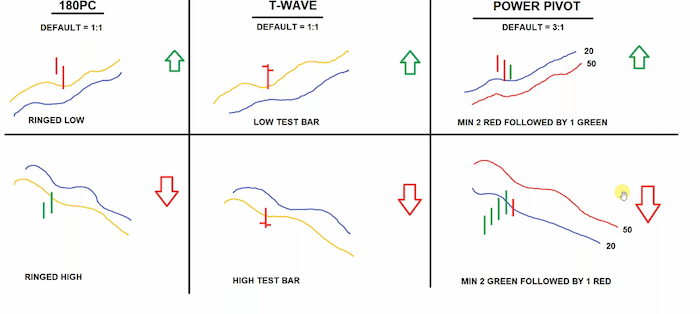
What makes a Power Pivot? A power pivot is minimum two red bars followed by one green bar.
What makes a T wave is the yellow above blue and what makes a 180 is a ringed low or a ringed high.
So the Power Pivot has a three to one automatically set up,
Whereas these other strategies are one to one, because we start you off as beginners, we then talk about three to one. Now you know why you might go for a three to one and why you might one to one. For two or three to one, it then becomes easier for you. It’s easy to spot as it’s just a change of colour. Yes, it is indeed.
Is it possible to see a 180. T Wave? And the Power Pivot all At the same time, yes of course.
I don’t want anybody thinking it’s really complicated. It’s not. It’s got the exact same criteria as a 180 or T-wave. It’s trying to get you in at the beginning of phase one on chart B or early after the cross on C and beyond that. It has some slight variation, but you see how you’ve seen that with two red and a green. And the good thing about that is it can be any two red and green.
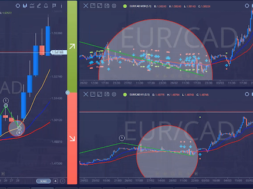
These two can be ringed lows, and that might be an inside bar, or it might not be. Guess what? It gives you another way to get in where the Power Pivot has an advantage also is this. You’ll understand now why the Power Pivot has a little bit more of an edge. Have a look at this. Look at the Power Pivot, M5, M15, M30 H1, H4, D1 . So a lot of traders like this.
Another thing that makes the Power Pivot even more interesting for you now you understand getting in. Look at this. Where the 180 and T wave would typically flash with this low test of green, low because the yellow is below the blue, it won’t flash.
Now you’ve got a power pivot. Guess what you get? You trade the power pivot off the 100 moving average. Yes. And the three to one is a default setup. It’s just a default setting for the power point it’s not that it can get more or won’t get more. It’s a default setting in the same way that you could set up a one to one on a 180 and watch you go to three or four to one, You and the three to ones and you and the one to ones or two to one has got nothing to do with wether or make it. It’s got to do with your assessment of the chart at the time.
If you set a three to one and walk away, it’s not going to work. You have to know where you are in the cycle. Then capitalise on being early in this move. I’m early in the move, I’m going to get in and go for a three to one.
That would make sense. But if I’m later in the move, going for a three to one wouldn’t have made much sense, because I know where the market is.
So it’s exactly what we did before. It’s timing. It’s got nothing to do with all the power. It’s going to give me a three to one. No, it’s just a default setting. So the Power Pivot has a default setting, which is, look, it’s a three to one, but they’ve set it that way, because that’s what we’ve always had it as many, many years ago. What you would do is say, Well, hang on, this trends been going for a while, I’m not going to do a three to one. In fact, a half to one because I could see I’m later in the move, or I won’t do it at all.
That makes sense. It’s up to you to assess the market. I’ll go from one to one, and I’m going to use my stock to break even halfway or whatever. Yeah, so you can adapt every single strategy.
So what is the Power Pivot specific rules? What you’ll see here is, of course, called a Power Pivot calculator. This was something that traders used to do way before Smart Charts.
This is what I was given in one of the courses. And I had to manually go through the chart to find this. This scoring system still works. You can turn it into your own version, because it takes away the emotion. So that’s what we like.
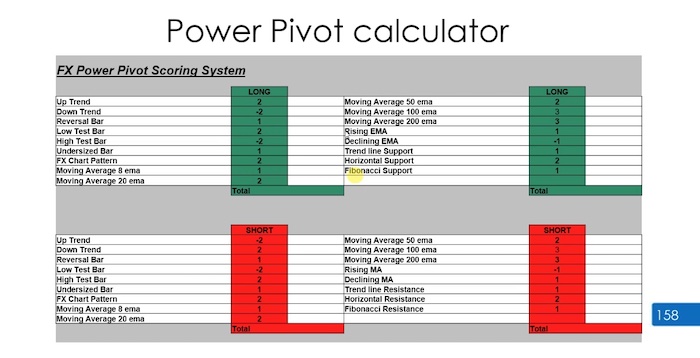
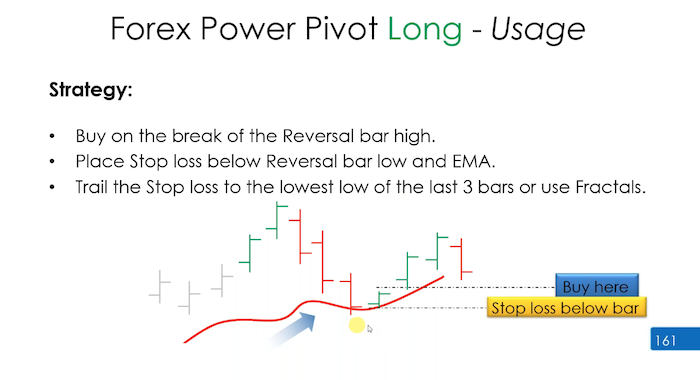
That’s what we like about it. We’ll come back to this. Want to show you so what you now know is no different to what we’ve done. The trend we want a reversal bar, which, on this occasion, isn’t a reversal like a train track or a high test or an inside, it is just a green bar after the two reds.
So just so you understand smart charts is doing the work for you. If you are doing this manually, your reversal bar is the green bar after the reds, or the red bar after the greens and the downtrend. And what we’re looking to do is find a nice spot that’s not too big, and then get in above the bar with a stop loss below the bar. Or, as we said, we always want to put our stop loss where the trade becomes invalid. It could be behind the previous swing. It could be previous lower here, or here, average horizontal level two, or whatever. And there’s some other ways of managing trades here.
I’ve already given you lots of ways to manage trade. You’re welcome to look into this one, and I don’t want to over complicate it, especially because its the end of the day, and I want you to realise that what you’re seeing here, as much as it’s new words and a new strategy, it is pretty much the cousin of something you need on a regular basis.
Power Pivot is really good because it gives us flexibility of timeframes, as I said, and you can then time it if, in case you miss a 180 or a T wave, let me show you the scoring system. The scoring system works like this. You can reverse it,
as I said to you, this was used manually, so everybody had to find their own trend and the reversal.
Now the Power Pivot does the reversible for you. It will not flash unless there are two greens and one red or two reds or green, what you’re going to do is not give yourself any points for the trend. Because anybody buying something should already have two points.
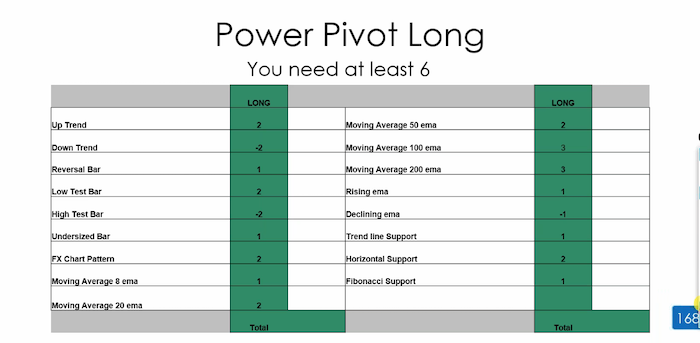
So I want you to try and get 6 points in total, without the uptrend and without the reversal, if you’re in an uptrend and you’re judging the chart, and you see a low test bar where there’s a power pivot you get 2 points, because a low test bar is bullish, if you see a high test bar, you lose two points.
So we’re trying to make it strict, and I’m looking for a Power Pivot. At the beginning of the phase one, I see a high test bar, I’m going to lose points.
I can’t give myself points, and I can’t ignore it. An undersized bar, you can write this down. Compare the size of the bar to the previous 20 bars. That bar is small or average. In comparison, that bar is undersized.
If you happen to see a double bottom, head and shoulders, double top reversal pattern, going up, it would be a double bottom, inverse head and shoulders.
Going down. It would be a double top and head and shoulders. If you see those patterns, or if you know your triangle patterns and you see a bullish pattern, give yourself 2 points because it’s bullish. Now you know your averages. You understand why we are giving more points higher the moving average
If you are found trading something off a 200 you would have got three points of a 100EMA 3 points because the market is in a nice place. It doesn’t mean it’s going to work. Remember that if the market is bouncing off multiple averages, you score points for every single touch.
I’ll show you an example of that shortly. The moving averages that you are touching should be rising, in general you get one point. If they’re going in opposite direction, you lose a point.
If the price action you are trading is bouncing on trend line, horizontal or Fibonacci, you get the respective points listed on the chart above.
And if you wish to add something like divergence, I always say divergence, it will get you two points.
We touched on this earlier. If I get all my boxes ticked, does it mean the trade is going to win? Is it?
Does the trade have a better chance of winning if all of these boxes are ticked, let’s say I get 12 points or 15 points.
Does it mean the trade is more likely to win earlier? Is an important one to bring up again, because I used to feel this way too.
Now it doesn’t. Well done. Paul, well done.
It’s not even higher probability. No, if that was the case, then we would just wait for those to give us a trade. I scored a trade, maybe 12, and then it lost. And the one that I scored six one, that’s what I realised.
Nothing to do with the scores, the score to keep you consistent. Think about it that we wouldn’t be having this conversation, guys, but just telling you from day one, guys, this is what you’re going to do. If you get all these boxes ticked, you’re not going to be guaranteed to win. Does that make sense? You just train?
So just because you’re one on one with a goalkeeper doesn’t mean you’re going to score. Because you’re the best striker in the world doesn’t mean you’re going to score. Score. Save it. You might get tackled. That’s why having every single box ticked It doesn’t mean you are going to win.
If you’ve got Harry Kane, he’s more likely to score this guy doesn’t miss, but he does miss the goalkeeper safes it. So that’s what this game is all about. So you’re going to use that score system for discipline. You’re going to put your averages on your Power Pivot.
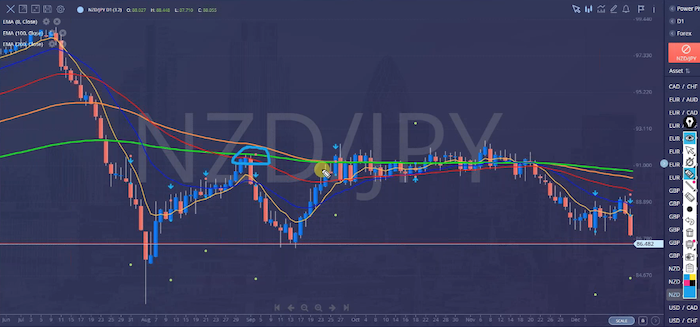
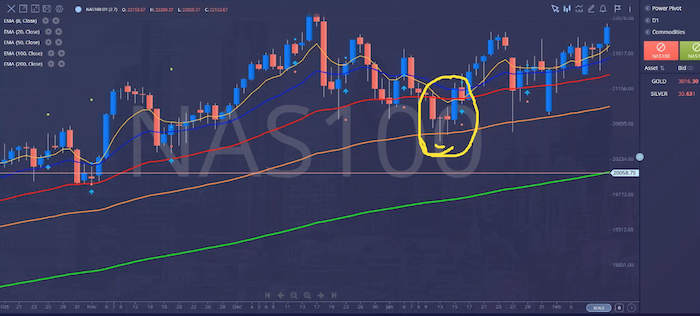
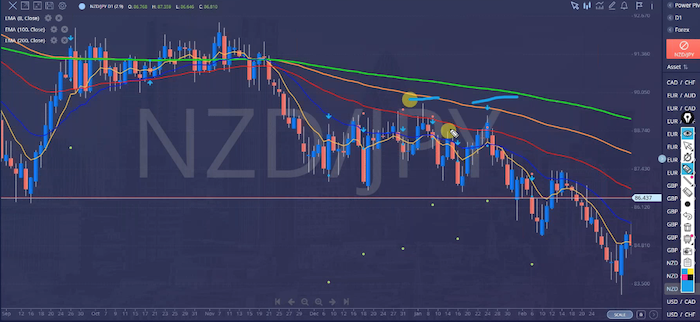
You can look at the power pivot with every asset you like. Here is an example of the market bouncing off the 50 EMA with a high test bar
Now I said to you, if you get multiple touches of averages, score points for all of them, here’s an example of the market touching both 50 and 200 and that alone gives you five points, traders, and you see that those five points you’re one away from getting six points, so that should also add to the value that, yeah, of course, six points doesn’t mean I’m going to win. It just means I’ve met my criteria, I’ve met my criteria, and I’m taking long term.\
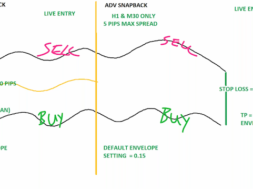
so traders power pivots. Fantastic way to get you in, another way to get flexible. Way to get across all assets. The last thing I want you to look at before I let you go is the Power Pivot. Is set by you in five pips. This is the power of it, default setup. Why is it like that? Always had it like that. So when they changed it and added Smart Charts and did 180s they felt that they would change it to one pip for the 180 and T wave and everything else.
This can be a little bit annoying, because when you go to a 5 minute or a 15 minute, have a look at this. You will see lots of power pivots that look like they should have brought you in, but don’t actually put you in, and that’s because it’s not five pips. So what I mean by that is,
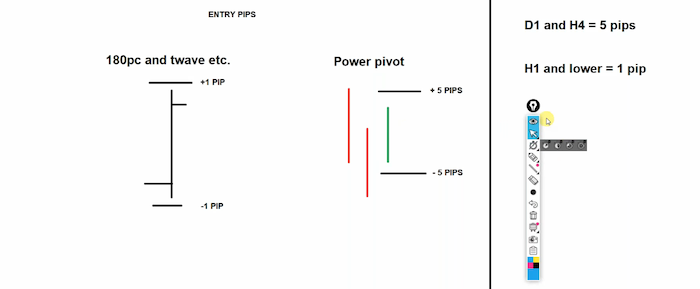
That looks like it should have brought you in, but it has to go five pips below the bar. That’s one and a half pips. So just don’t even think too much about this. So going forward use PIP entries and stop losses 5 pip on D1 and H4 by moving the entry and 1 pip entry for h1 and ANYTHING LOWER
Some of you have done very well, and some of you haven’t done so well. This all comes down to your trading personality, and it’s that single, frame of reference that you need to understand, which is, there’s a reason why some of you are doing better than others, and that all comes down to self awareness. Am I aware that my attention is drifting in the cars? Am I aware that I’m not doing the right thing?