


When we talked about timeframe correlation we didn’t really mention getting in, because getting in is the easiest part. You’ve got another four or five bars to get in to a trade now, inside bars, outside bars, train tracks, double bottoms, double top. There’s so many ways to get here. But if it wasn’t drilled into you that the correlation of time frames is critical then it may well kill you as a trend trader. If you don’t get that right, you’re not going to have any success. I didn’t know that when I started, so I was busy looking for the best strategies. I kept on changing strategies. This is what I wish I knew back then. It would have saved me a lot of time, because patterns repeat themselves. It doesn’t go anywhere. So my advice to you is, if you do not know this like the back of your hand, then realistically. This should move it to number one one your list of things to do.
There’s no point of learning price action if timeframe correlation isn’t there, because you can actually get away without using price action but not so with timeframe correlation. Then getting in to trade with the strategies that give you signals. That is a fact, and I’ve done a lot of study. I’ve got a hard drive in my own that was given to me by a trader that has got 1000s of hours and content, I’m not exaggerating of content in trading. And you know what the common theme is? I haven’t gone through all of it, because it’s impossible to go through all of it. Everyone’s saying doing pretty much the same thing.
Somehow we think Joe next door has got a better course than Greg. Greg’s course is better than Sam. Sam’s course is better than Michael’s and and so on in going around the circle. We realise that it’s all psychology and time frame correlation. So we’re going to do a bit of recapping on what we did yesterday, I’m going to ask you some important questions to see how much you retained time frame correlation. As I just said, in my opinion, is number one, along with price action and horizontals, are some of the most important parts of trading profitability.
Timeframe correlation is the agreement between timeframes that allows you to get into longer term moves on smaller timeframes. So it’s that agreement of timeframe, the art of getting in here is what we’re trying to focus on. Because if I try and get you here 100 times, you will see why the odds will eventually, and in all probability will eventually go in our favour, because I’m getting in at the beginning of phase one on Chart B, so the odds are going to be with me.
Eventually I will get some big wins. This can and does lower the success rate slightly, but will massively improve your reward to risk. I’ll be showing you later in this course how to go for two, three, or possibly even more to one. For those of you that are not really concerned about success rate, you can meet the game with 50 winners, 50 losses, but because your winners are making on average, two to one your losses are losing 1% you don’t care, you’re going to be up exponentially. This is where we stop caring about success rate.
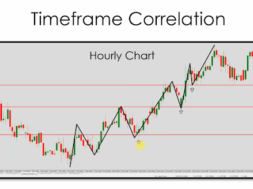
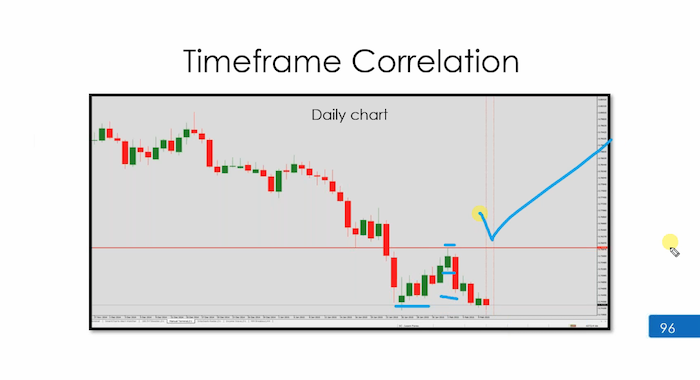
Please take a look at this chart. I’m going to deliver the necessary information. I want you to tell me, based on what we covered yesterday,
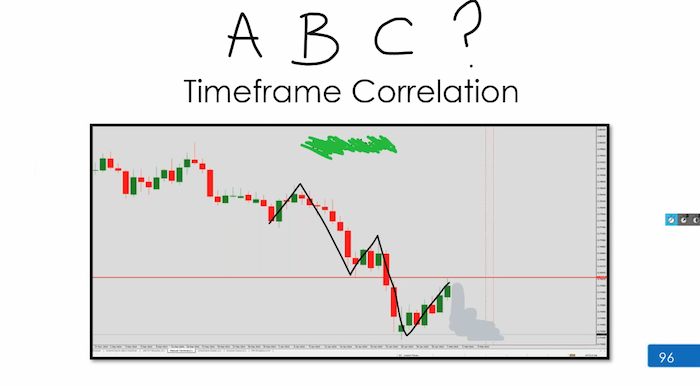
I’m focusing really on the black lines to make it easier for you.
If we pretend we can’t we know what happened here. We know it went down. I’d like you to look at the black lines. Just look at the black lines and tell me which chart is this. It can only be one. I want you to think about what was said yesterday. Which chart is this case? Look at the black lines only. Do not think. Do not guess. The black lines highlight the specific rules you are looking for. Tell me what chart is this because this is about you moving forward, if we’re getting this right, it means you can move on.
You’re thinking, hang on, I’m getting this please write the answer. Don’t be afraid to get it wrong, because I will give you the answer. Which chart is it? Don’t worry about the two bar rule. I’m not using the two bar rule. I
But you are right. If you’re a two bar rule person, then you would have to use a two bar rule. I’m not using the two bar rule because guys, but yes, so far, every one of you has got it right. This is going to be very rare occasion. This happens once every nine months, if that, honestly you don’t get many people getting this right altogether. So something is clicked in the water you’re drinking. Yes, everyone, well done. Please take a screenshot. Write this down. Page, 96
Chart B, everyone. We’re gonna ask you some key questions. These questions really do determine how well you know this it is. Chart B, does it have anything to do with the time frame answers in advance, does it have anything to do with the time frame? The answer should be, well, I got rid of it. That’s why the answer should be easy. Does it have anything to do with the time frame? Why do you think I crossed it out that should make the answer easy for you? I cross the time frame out. Time frame out because it’s got nothing to do with the time frame, because chart B can be any chart. Chart B can be any chart. You have a time frame is an important issue, its the shape and the pattern in the market that’s important.
Correct? Can I trade chart B, can I trade this ring high to 180 phase change. Can I trade this chart B? It’s chart B.
So, basically, yes, we can. It’s got nothing to do with chart A going down. It’s about focus. It can be done. Chart B can be done. That is it? That’s the end. We don’t add anything else, because you saying that if chart a is going down, well, you know that’s actually not true. Is it? Why is that not true?
Because look, chart A could be doing this. This area on the chart be phase two.
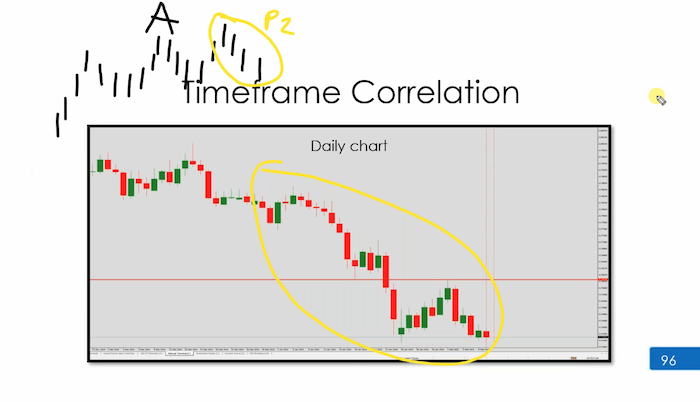
Do you understand we said this yesterday. We prefer it to be phase one, but it can be phase 2. We know that phase 2 could be this whole thing.
This could be, chart A, don’t forget chart A doesn’t even have to be trending. Remember that chart A can be really doing weird stuff like that. We just need to get the direction of the trend. This is not even trending, its got a lower high and then a higher low, but we’ve got that area.
Remember, the focus is to start with B, and if you have at least two cycles on B, then the number of bars of a don’t matter.
That’s what makes it really cool. So you don’t have to go looking for a certain number of bars. That’s the key. Yeah. That’s why there’s a method to everything here. If you look for two cycles or three cycles on Chart B, chart A could look whatever it like. Can look like whatever it wants to you just want to make sure you’ve got the general direction of a as the saviour.
You can get away with just looking at B and C, by the way, can do that, yeah, just say, Look, I’m going to do B and C for now. Make some sense of it, and then, excuse me, I’ll add chart A later.
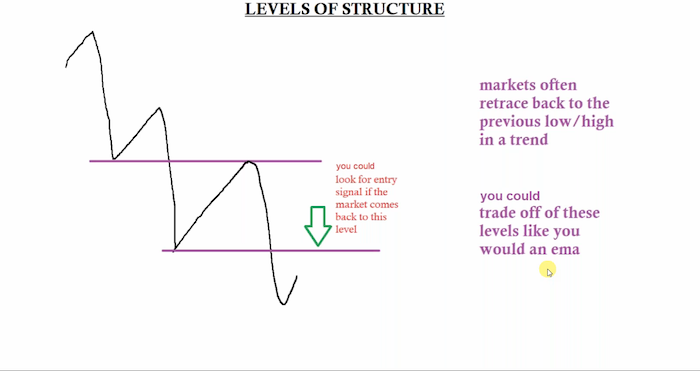
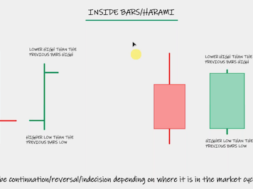
This is something that I want you to notice. We look for typical support and resistance, but we also have breaks of structure, highs and lows. We talk about market breaking previous lows and highs, and then we also have the price coming back, touching previous low. Why is that significant? Because it means we can trade off it. Every single one of you can trade off this chart B but to make it interesting. I’m going to show you something. So stop loss here, entry here. And if we were to target the previous load, which is something you will see a lot.
Then you get yourself just over 1% there is nothing wrong in anybody saying.
CHART A Direction
CHART B Phase
CHART C Execute
Look, I get chart A. It’s drilled into me. No, I want to trade it earlier. Don’t want five or six cycles. I want two or three cycles. But let’s make it interesting. If this is chart B, what is this?
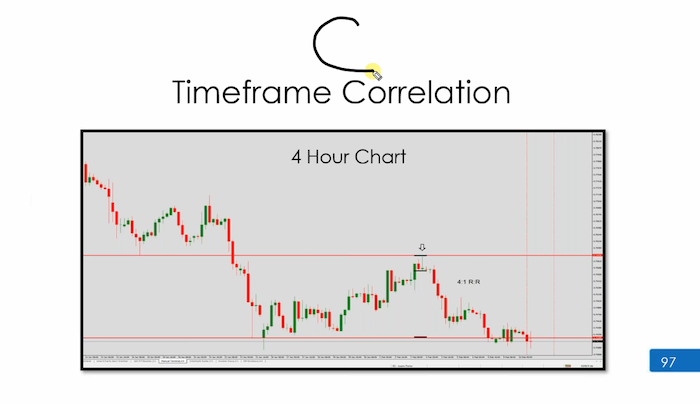
Everyone Answers in the box, what is this? It has to be chart C.
Correct. How do we know that it’s messy, it’s untidy. Look at the opportunity of the same horizontal level, but instead of getting in on the B. You could have got in early bit more aggressively with the high test bar, if you traded this high test bar, that move produces a 4:1 question with this. It’s a high test bar, would we get a T wave signal? Would we get a T wave signal, since it’s a high test bar, would we get a T wave signal down? Yes or no?
I’m expecting a few light bulb moments from this, because then you understand why you have the licence to manually execute. I’ll ask the question again. Now you’ve seen something on the screen to help. Would we get a T wave signal? The answer is categorically no. Why? Because smart charts has been told. Give me a signal down if the yellow is below the blue.
Could we have overridden that and go to our no strategy and typed the words “high test” You’ve done your analysis. You’re looking to be a seller. It’s got nothing to do with a T wave. The fact is, you’ve seen a bar that gets you in, but because the T wave relies on the yellow the blue being in order, it would not give you a signal. Therefore, yes, you would go to the manual chart, type in “high test” and place it manually.
This is how we get an edge. Yes, this is why I said yesterday, you can type in the name. I showed you how to type in the name. You would type in “high test”, and you’d put this position on and that would be you done. If it becomes a loser. No biggie. If it’s a winner, no biggie. We move on.
We move on to the next chart.
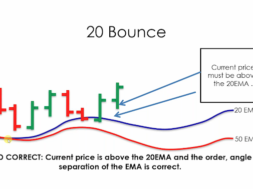
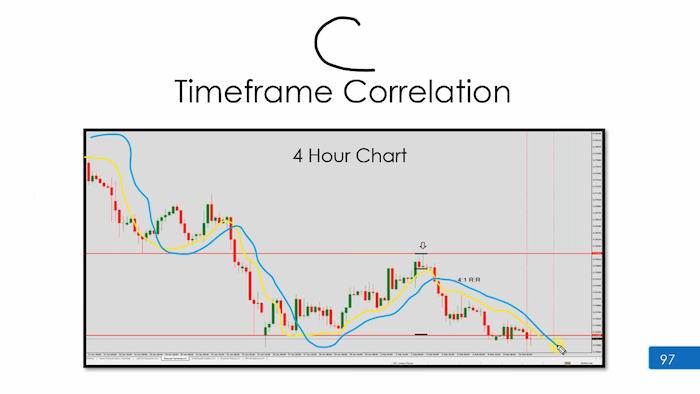
The EMAs seem less important, yeah, when you can read the price, you start to realise you don’t necessarily need an EMA to give you the most perfect signal. You’ll clock it. You’ll go, actually, I’m already planning on being a seller. So whether I have a perfect average or not doesn’t make any difference.
I feel like, at least until now, I’ve almost been relying on EMAs. We’re analysing and that’s okay, that’s how you’ve been taught. But we are showing you different ways, aren’t we? We’re unravelling things. So there’s nothing wrong in that, just giving you an opportunity to see the market in a different way. If you said to me, “I want to get in early after the cross,” then you’d be getting in somewhere here. That’s still a rule. That’s still relevant. You with me?
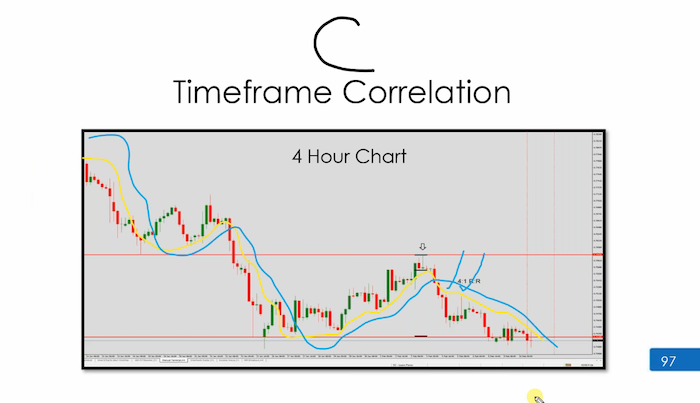
This is just me saying, if you wanted to get in earlier, if you saw a double top here (broad arrow down), you could have done it, but if you didn’t see a signal, you weren’t comfortable, you wait for the EMAs to cross. My averages are not perfect, obviously, and then you get in somewhere here early after the cross, and take the price down.
This is now gone to 4:1. Yeah. Price is leading. EMAs are lagging, yeah, but it’s not a negative, because the EMAs do really good. They give us a real clear idea of what’s going on.
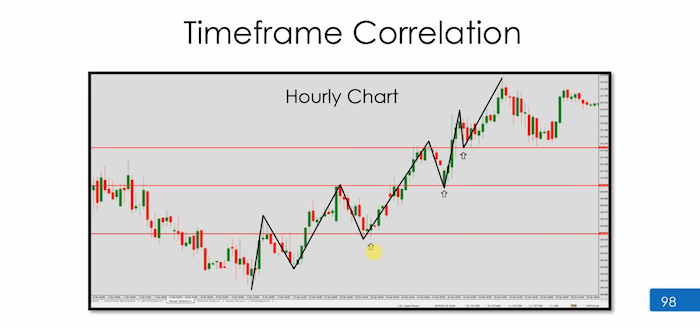
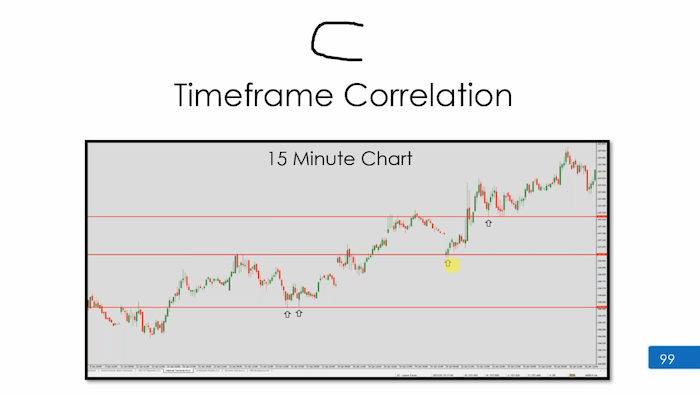
Let’s have a look at this brand new chart. This chart’s got nothing to do with the last one. This is a second example. Look at the black lines again and tell me. What is this? Is it B, A or C?
Look at the black lines only the black lines are the answer. This is really important that you focus on the black lines. This is not even a guess. This is a black the black lines. Look at the first arrow as well. Look at where the first arrow appears. If you look at the black lines, you will know what it is. So focus on the black lines.
Some of you have got it right, a couple of you haven’t. And I think why, and that’s okay. This is chart B. Again, everyone. It is a chart B. Look at the black lines. Look at the first arrow. The market is moving up, one cycle, two cycles, arrow, second cycle, third cycle, fourth cycle. This isn’t messy. You might think it is, but when you see chart C, you will understand why this isn’t messy.
Please write down page 98 it’s chart B.
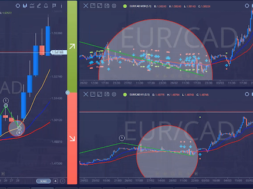
Have a look at this. Keep an eye on these arrows. There are three spots that we could have traded with. Chart B, watch this. Can you see those of you that said chart C, can you now see why this is chart C, If you thought that was messy, let me see.

Yeah, great, isn’t it? Can anybody see the double bottoms reversal patterns here? Look at how messy this chart is. But what is the good news? The good news is we’ve already got our direction from a higher time frame. We are not on this 15 minute chart to start looking for cycles. If you’re looking for cycles on your chart, C, you are late You need to be getting in where it looks a bit untidy, a bit crazy. Why? Because we’ve already got the direction from the higher time frame.
I hope this is making sense to you.
I want you to study chart B’s and C’s. Look at this you could have got in above here. (Up arrows) Get your head around that at the bottom there, and even with the gap. I mean, bit crazy, but you just got to find a bar anywhere there you could use any one of these bars low test, inside bars would probably flash in pip runner to get in here and here, we did the work here that’s all that matters.
So higher time frames provide what provide us with our direction and a lower timeframes, like us execution. It is all about timeframe agreement. You need at least two timeframes. You need to have those time frames in order doing their thing you good to go.
Try to plan your trades, wait for price to get to certain levels and then execute. If you do so, you will be much better. Those levels are moving averages, horizontals, trend line, Fibonacci, pivot lines, Bollinger Bands, you don’t execute randomly. You tell yourself what you’re waiting for, that is what you’re waiting for, and we stick to that.
We go down to another time frame, and we execute. I would urge you to use the examples, the four examples in the manual we’ve just gone through this morning at your guide for chart B and C, I would print them out, I would have them in front of me, and I would try and replicate that. If you can replicate that, you will find that a lot easier to execute with chart B and C.
If we’re looking at cycles and chart B and C at double bottom, it means it’s not chart B. It means the market isn’t shaped, right. So you need to shift everything you with me, you have to shift everything your chart B shouldn’t be doing. That means chart B is not doing what chart B should be doing.
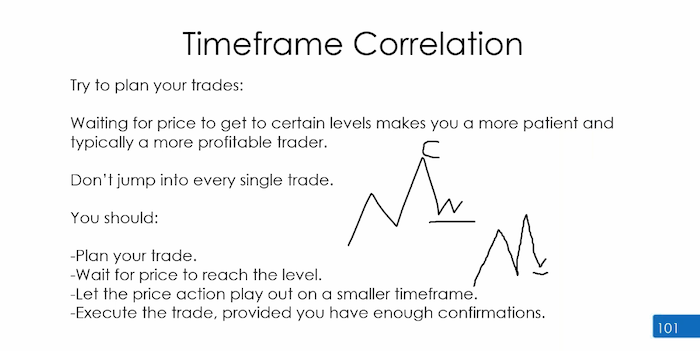
Chart B is really just meant to look like that, that that’s what you wanted to do, if you were to shift the time frame, then this would then your what you thought was chart B could then become chart C, and then you’d move up, and you’d probably see the higher Time Frame looking like that.
So that would be that good. Would you trade the high time frame and the lower one at the same time? Choose one. If you’re trading chart B, you stick to chart B. If you’re trading chart C, you stick to chart C. You do that 100 times. We’re talking repetition. You don’t keep shifting and moving. There will come a time where your brain will just go I’ve got it, and you’ll know how to operate in and around time frames, but where you are now, or you have to be doing either chart B, saying that’s what I’m happy with, or I will do chart C, I’m happy with that.
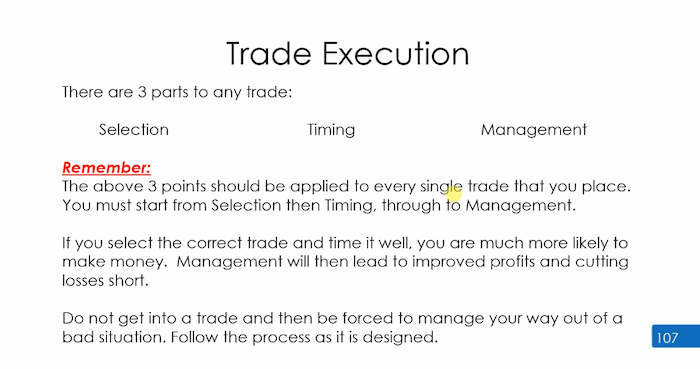
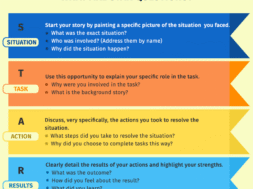
This is all about a process, and the process is called selection, timing, management. These above three points must be applied to every single trade that you place. Selection is where we begin. Those of you that haven’t done an Advanced Boot Camp, we’ve been using the basic methods of selecting an asset. If you’re going through the entire list, you’re running through the list one of us have given you, and if you’ve done Advanced Boot Camp, you would have heard me talking about strength, weakness and other advanced indicators to select an asset, then it’s about timing.
That is the strategy to get the in. If you select the correct trade and time it well, you’re much more likely to make money long term. It’s the way we manage the trade that will allow us to get better profits and reduce our losses. Do not get into a bad trade and be forced to manage your way out of it. Follow the process.
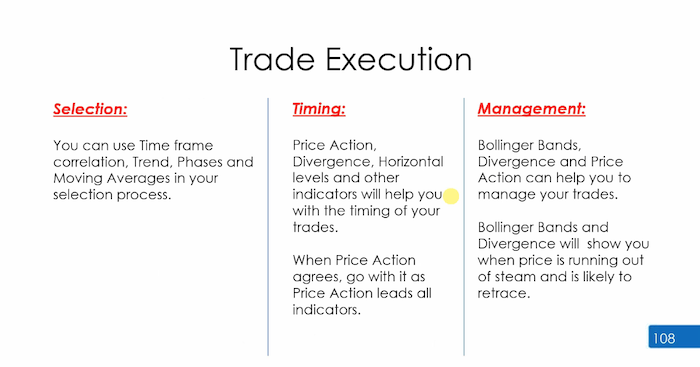
Some other ways we can select is the 50 and 200 moving averages, different correlation prints, phases, strength and weakness, fundamentals, I want to buy gold because that’s your selection process. Then you decide when you want to do that with price action, divergence, horizontal levels already, and when price action agrees with it that pretty much leads management.
We’re going to be talking about management , so can use things like Bollinger bands, divergence, Fibonacci extensions to help us get the most from a move.